Limiting Factors of Photosynthesis
· A limiting factor is the factor in shortest supply that prevents the rate of photosynthesis increasing further.
· Main limiting factors required by CIE: light intensity, carbon dioxide concentration and temperature.
· Photosynthesis rate is usually measured by: oxygen production, carbon dioxide uptake, colour change of redox indicators, or rate of decolourisation.
· When one factor is limiting, increasing that factor increases the rate until another factor becomes limiting.
· In graph questions, the steep/rising part shows the x-axis factor is limiting; the plateau shows another factor is limiting.
These graphs show how each environmental factor can limit photosynthesis. A rising curve means the factor on the x-axis is limiting; a plateau means another factor is now limiting. Source
Effect of Light Intensity
· Light provides energy for the light-dependent reactions.
· At low light intensity, light is limiting, so increasing light intensity increases photosynthesis rate.
· At high light intensity, the rate reaches a plateau because light is no longer limiting.
· At the plateau, another factor such as CO₂ concentration, temperature, chloroplast pigment availability, or enzyme activity limits the rate.
· In investigations, light intensity can be changed by altering distance from a lamp; remember: light intensity ∝ 1 / distance².
· Control variables: temperature, CO₂ concentration, plant species/mass/leaf area, time, lamp type and volume of solution.
Effect of Carbon Dioxide Concentration
· Carbon dioxide is needed in the Calvin cycle to combine with RuBP during carbon fixation.
· At low CO₂ concentration, CO₂ is limiting, so increasing CO₂ increases photosynthesis rate.
· At high CO₂ concentration, the graph reaches a plateau because another factor becomes limiting.
· CO₂ concentration in aquatic plant investigations can be changed using different concentrations of sodium hydrogencarbonate / potassium hydrogencarbonate solution.
· In exam answers, link CO₂ limitation to reduced GP formation, reduced TP production and lower production of organic molecules.
Effect of Temperature
· Photosynthesis is controlled by enzymes, especially in the Calvin cycle.
· At low temperatures, enzymes and substrates have less kinetic energy, so there are fewer successful collisions and photosynthesis is slow.
· As temperature increases, photosynthesis rate increases up to an optimum temperature.
· Above the optimum, enzymes may denature, so active sites change shape and the rate decreases sharply.
· Temperature affects photosynthesis most strongly when light intensity and CO₂ concentration are not limiting.
· Use a water bath or controlled temperature environment to keep temperature constant during practical work.
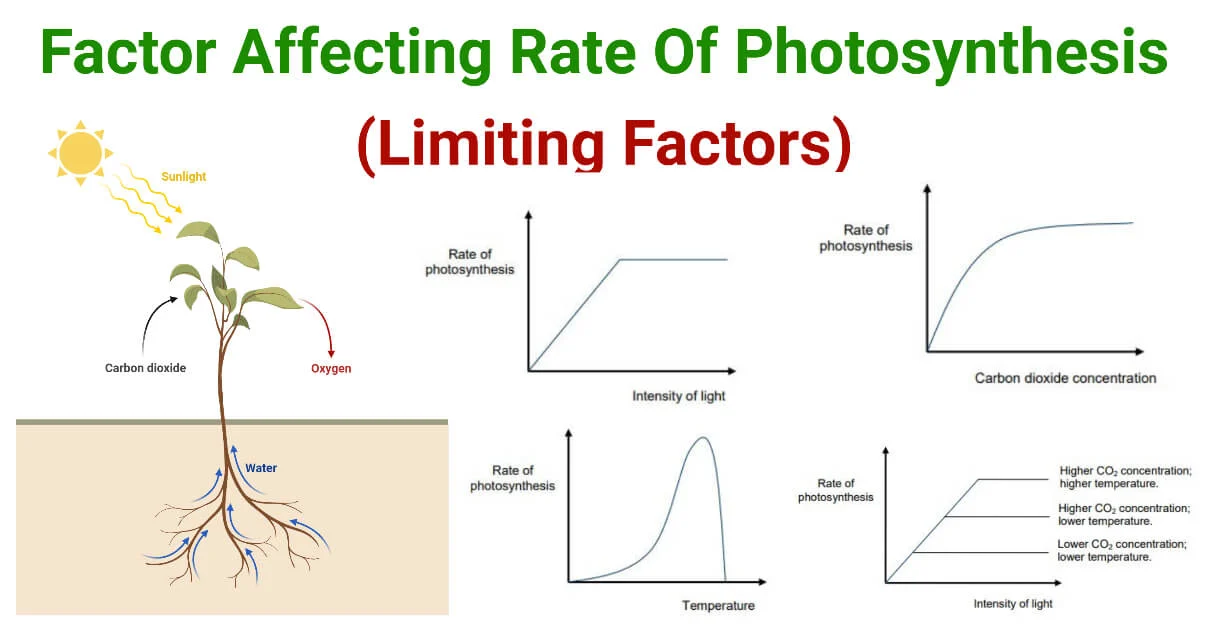
This image summarises the three CIE limiting factors in one place. It is useful for comparing the shapes of light, CO₂ and temperature graphs. Source
Investigating Photosynthesis Using Redox Indicators
· CIE requires investigations using DCPIP and methylene blue with a chloroplast suspension.
· DCPIP and methylene blue are redox indicators that change colour when reduced.
· In the light-dependent reactions, excited electrons normally reduce NADP; in the practical, the redox indicator can act as an artificial electron acceptor.
· DCPIP is blue when oxidised and becomes colourless when reduced.
· A faster loss of blue colour means a faster rate of the light-dependent reaction.
· Use a colorimeter to measure change in absorbance objectively, or time how long the indicator takes to decolourise.
· Keep chloroplast suspension cold, use equal volumes, and standardise chloroplast concentration to improve reliability.
Investigating Light Intensity and Wavelength with Chloroplast Suspensions
· To test light intensity, place tubes at different distances from a lamp or use filters/screens to reduce intensity.
· To test wavelength, use different coloured filters or LEDs, such as red, blue and green.
· Prediction: red and blue light usually give faster photosynthesis because chlorophyll absorbs these wavelengths strongly.
· Prediction: green light usually gives a slower rate because much green light is reflected or transmitted.
· Measure rate by time taken for DCPIP to decolourise or by decrease in absorbance using a colorimeter.
· Include controls such as a dark tube, boiled chloroplast suspension or tube without chloroplasts to show the change depends on active chloroplasts and light.
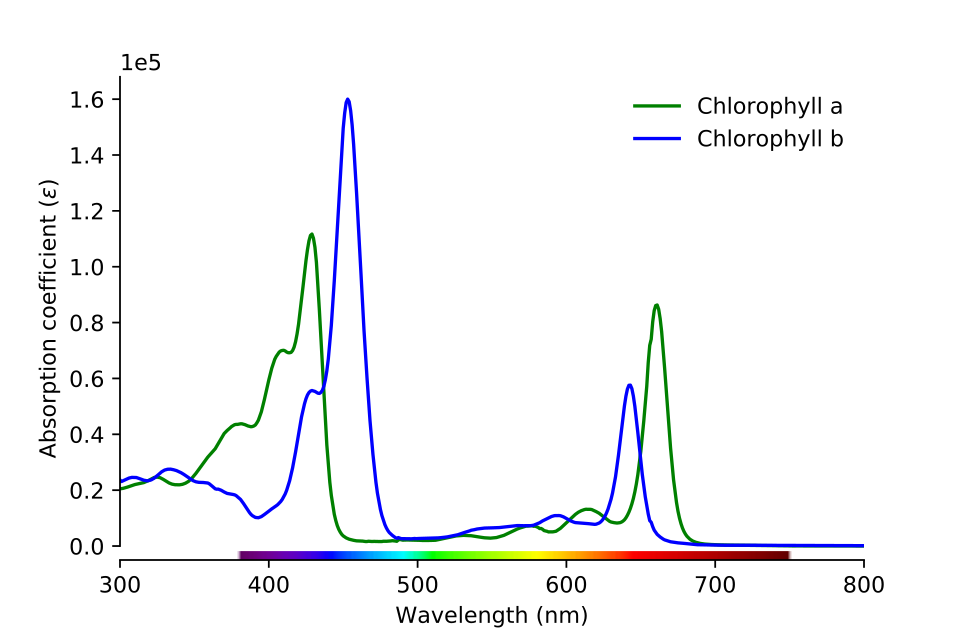
This graph shows that chlorophyll absorbs red and blue light strongly but absorbs green light poorly. It explains why wavelength affects the rate of photosynthesis in chloroplast suspension experiments. Source
Investigating Whole Plants and Aquatic Plants
· CIE requires investigations using whole plants, including aquatic plants, to test light intensity, CO₂ concentration and temperature.
· Aquatic plants are useful because oxygen bubbles released during photosynthesis can be counted or collected.
· Possible dependent variables: number of oxygen bubbles per minute, volume of oxygen collected, or change in CO₂ indicator colour.
· For light intensity: change distance from lamp and calculate intensity using 1 / distance².
· For CO₂ concentration: use different concentrations of hydrogencarbonate solution.
· For temperature: use a water bath and allow time for the plant to equilibrate before recording results.
· Repeat readings, calculate a mean, identify anomalies, and plot a graph of rate of photosynthesis against the independent variable.
· Limitations: bubble size may vary, oxygen may dissolve in water, plant activity may change over time, and temperature may rise from the lamp.
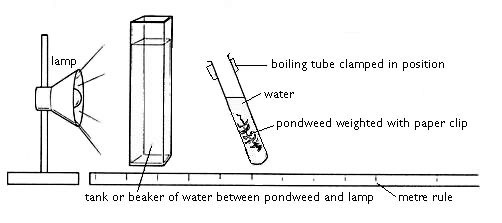
This practical setup is relevant for measuring photosynthesis in whole aquatic plants. It links directly to CIE-style investigations where oxygen production is used as a proxy for photosynthetic rate. Source
Interpreting Limiting Factor Graphs
· If the graph is rising, the factor on the x-axis is probably the limiting factor.
· If the graph levels off, another factor is limiting.
· A higher curve usually means another condition has been improved, such as higher CO₂ concentration or a more suitable temperature.
· For temperature graphs, expect a rise to an optimum followed by a fall due to enzyme denaturation.
· For light and CO₂ graphs, expect a rise followed by a plateau, unless very high values cause stress or damage.
· Always describe the trend first, then explain it using light-dependent reactions, Calvin cycle enzymes, CO₂ fixation, or enzyme denaturation.
Practical Design and Evaluation
· Independent variable = factor deliberately changed, such as light intensity, CO₂ concentration, temperature or wavelength.
· Dependent variable = measured outcome, such as photosynthesis rate, oxygen produced, or DCPIP decolourisation time.
· Control variables = all other factors kept constant to ensure a valid investigation.
· Use repeats and calculate a mean to improve reliability.
· Use a colorimeter for redox indicator investigations to reduce subjective judgement of colour change.
· Use a heat filter or LED lamp to reduce heating when investigating light intensity.
· Allow time for plants or chloroplast suspensions to equilibrate before measuring.
· Plot results clearly with independent variable on the x-axis and rate of photosynthesis on the y-axis.
Checklist: can you do this?
· Define a limiting factor and identify when light, CO₂ or temperature is limiting from a graph.
· Explain the effects of light intensity, CO₂ concentration and temperature on photosynthesis rate.
· Describe how to use DCPIP or methylene blue with chloroplast suspensions to investigate photosynthesis.
· Describe how to use whole plants or aquatic plants to investigate limiting factors.
· Evaluate practical methods by identifying controlled variables, limitations, repeats and improvements.