Phenotypic variation
· Variation = differences between individuals of the same species.
· Phenotypic variation = differences in observable characteristics, caused by genetic factors, environmental factors, or both.
· Genetic factors = inherited alleles affect phenotype, e.g. ABO blood group, sex, inherited disease traits.
· Environmental factors = conditions affect phenotype without changing genotype, e.g. diet affecting body mass, sunlight affecting plant growth, training affecting muscle size.
· Genetic + environmental factors interact in many traits, e.g. height, mass, skin colour, crop yield.
· Exam tip: always state whether variation is caused by genes, environment, or both, and give a named example.
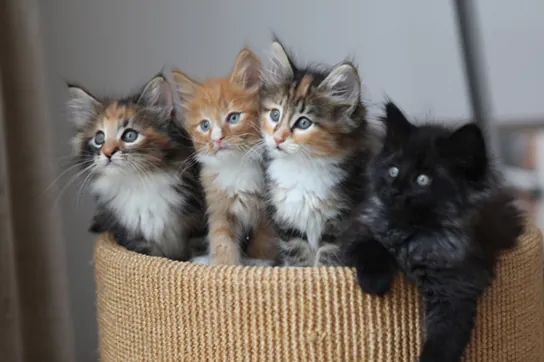
This image shows phenotypic variation within one population. It is useful for explaining that individuals of the same species can show visible differences due to genetic and environmental influences. Source
Discontinuous variation
· Discontinuous variation = phenotypes fall into distinct categories with no intermediates.
· Usually controlled by one gene or a few genes.
· Environmental influence is usually small or absent.
· Data are usually qualitative or categorical.
· Best displayed using a bar chart, because categories are separate.
· Examples: ABO blood group, sex, ability to roll tongue if treated as a simple categorical trait in exam data.
· Exam wording: “There are separate classes and no continuous range of values.”
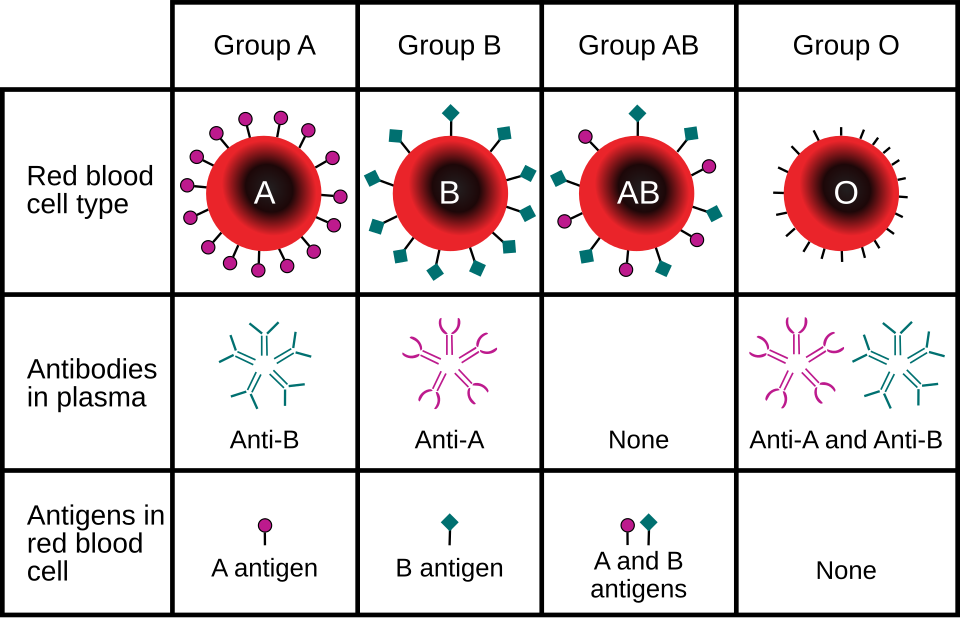
This diagram supports discontinuous variation because ABO blood group phenotypes fall into distinct categories: A, B, AB and O. There are no intermediate blood groups between these categories. Source
Continuous variation
· Continuous variation = phenotypes show a range of values between two extremes.
· Usually controlled by many genes = polygenic inheritance.
· Often strongly affected by the environment.
· Data are usually quantitative and measured, e.g. in cm, kg or mm.
· Best displayed using a histogram or frequency distribution curve.
· Often shows a normal distribution: most individuals near the mean, fewer at the extremes.
· Examples: height, body mass, leaf length, milk yield, skin colour.
· Exam wording: “There is a wide range of intermediate phenotypes.”
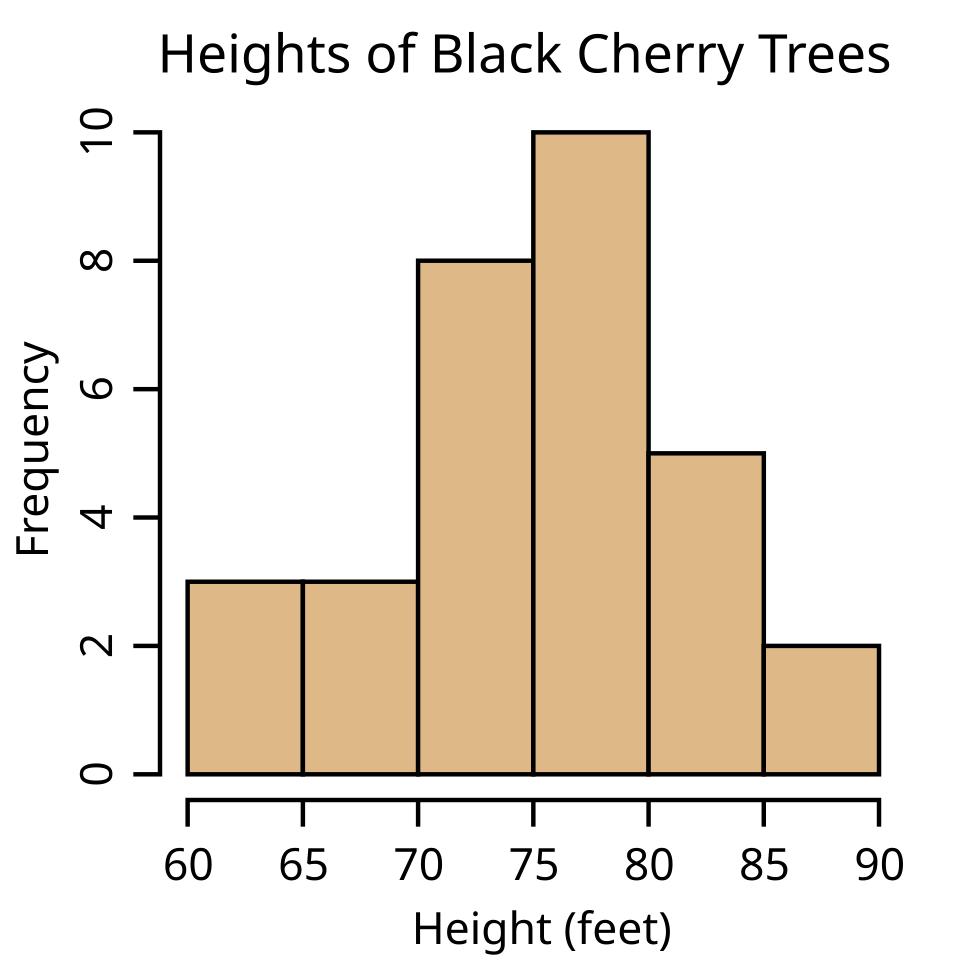
A histogram is the correct graph for many forms of continuous variation because values are grouped into numerical intervals. This helps show patterns such as a normal distribution. Source
Genetic basis of variation
· Discontinuous variation often results from different alleles at a single gene locus.
· Example: ABO blood group is controlled by alleles that produce distinct blood group phenotypes.
· Continuous variation usually results from polygenic inheritance, where many genes each have a small additive effect.
· More genes involved → more possible genotype combinations → wider range of phenotypes.
· Alleles create inherited variation; only genetically based variation can be passed to offspring.
· Mutation, meiosis and fertilisation from earlier genetics topics explain how new allele combinations arise.
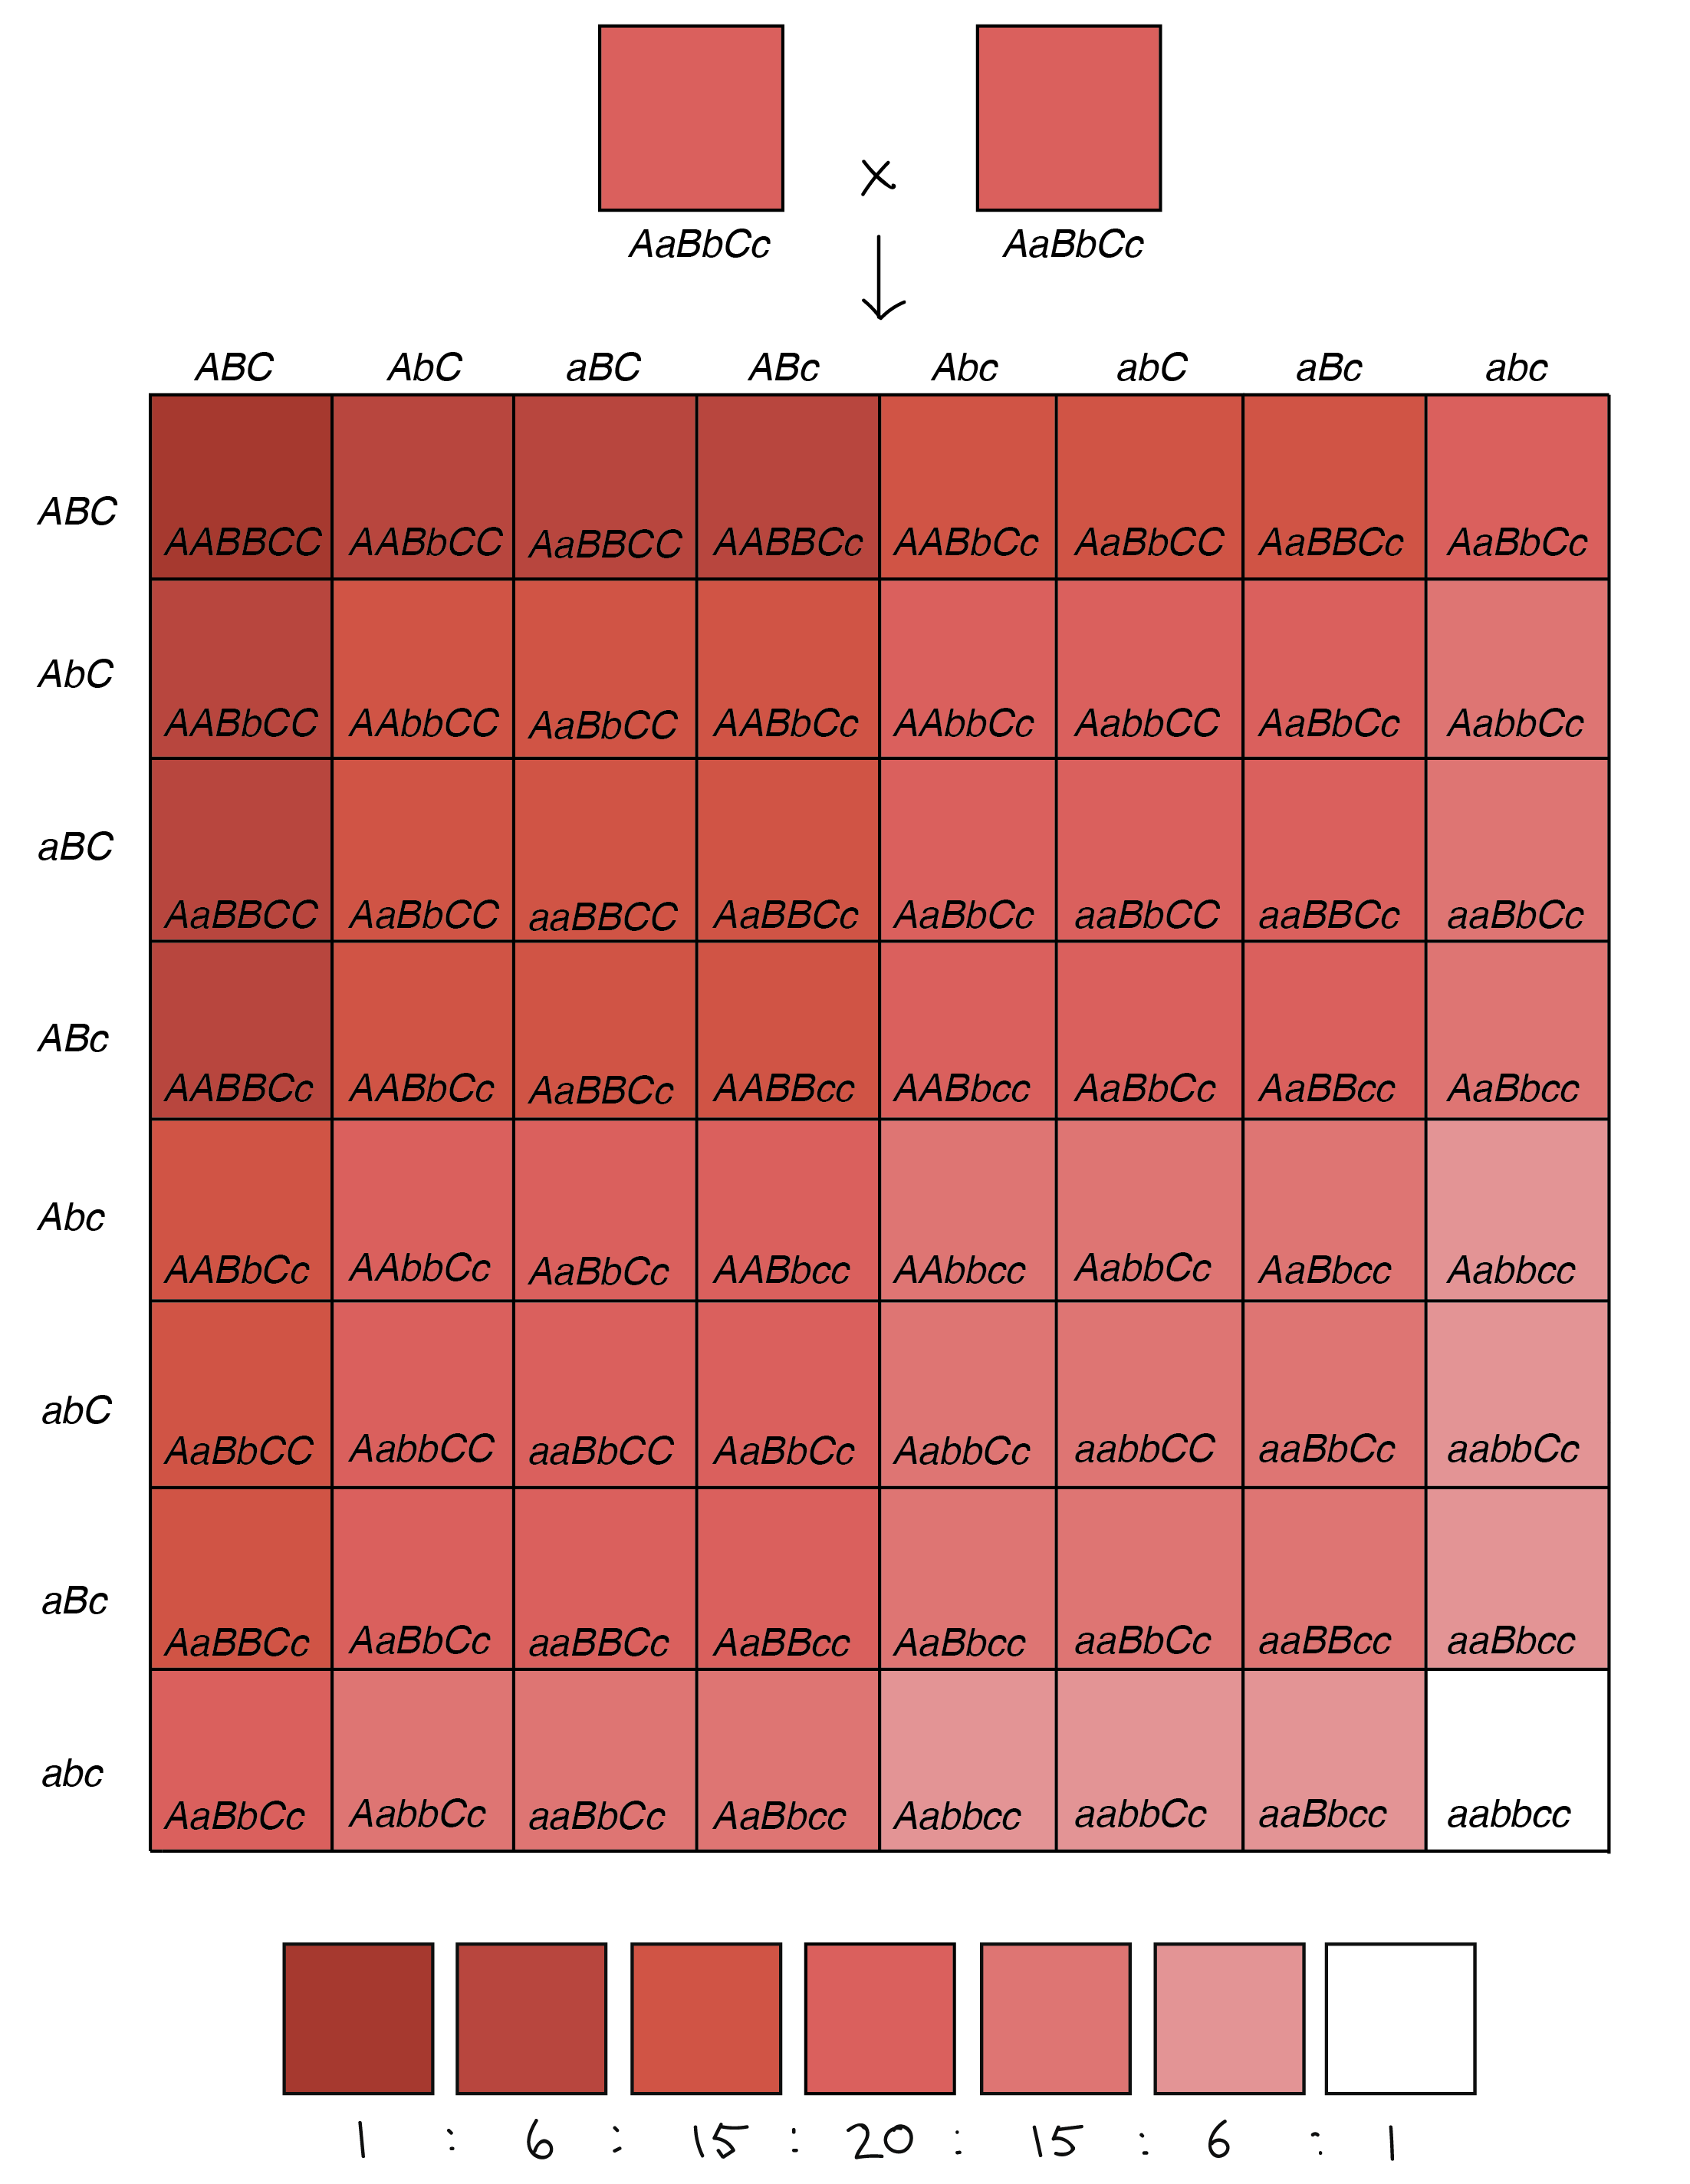
These diagrams show how traits controlled by many genes can produce a broad range of phenotypes. They are useful for linking polygenic inheritance to continuous variation. Source
Environmental effects on phenotype
· The environment can alter phenotype by affecting growth, development or gene expression.
· Examples: nutrition affects height and mass, light intensity affects plant growth, temperature may affect enzyme-controlled development.
· Environmental effects do not usually change the genotype.
· A genetically identical organism may develop different phenotypes in different environments.
· For exam answers, avoid saying “environment changes genes” unless the question is specifically about mutation.
· Better wording: “The environment affects the expression of the phenotype.”
This diagram shows how the same or different genotypes may produce different phenotypes in different environments. It is useful for explaining environmental influence on phenotypic variation. Source
Comparing discontinuous and continuous variation
· Discontinuous: distinct categories; continuous: range of values.
· Discontinuous: usually one/few genes; continuous: usually many genes.
· Discontinuous: little environmental effect; continuous: often strong environmental effect.
· Discontinuous: displayed using a bar chart; continuous: displayed using a histogram or frequency curve.
· Discontinuous example: ABO blood group; continuous example: height.
· Exam tip: if the x-axis has categories, use a bar chart; if the x-axis has numerical ranges, use a histogram.
Using the t-test
· The t-test compares the means of two samples to decide whether the difference between them is likely to be significant.
· Use when comparing a continuous variable between two groups, e.g. mean leaf length in two plant populations.
· The formula will be provided in the exam, so focus on knowing when to use it and how to interpret it.
· General method: calculate mean, calculate or use standard deviation, substitute into the given t-test formula, then compare calculated t with the critical value.
· Null hypothesis: there is no significant difference between the two sample means.
· If calculated t > critical value, reject the null hypothesis: the difference is significant.
· If calculated t ≤ critical value, accept / fail to reject the null hypothesis: the difference is not significant.
· Always use the correct degrees of freedom and probability level given in the question or table.
· Exam tip: never write “proves”; write “the data support” or “suggest a significant difference.”
Checklist: can you do this?
· Explain whether a phenotype is caused by genetic factors, environmental factors, or both.
· Distinguish continuous variation from discontinuous variation using examples.
· Link single/few genes to discontinuous variation and polygenic inheritance to continuous variation.
· Choose the correct graph: bar chart for discontinuous data, histogram/frequency curve for continuous data.
· Use and interpret a t-test to compare the means of two samples.
Common exam traps
· Do not say all variation is genetic; some is environmental or multifactorial.
· Do not use a line graph for discontinuous categories.
· Do not say continuous variation has “groups”; it has a range of values.
· Do not say a t-test proves a difference; it tests whether the difference is statistically significant.
· Do not confuse phenotypic variation with genetic variation: phenotype includes the effect of the environment.