Ecosystems and niches
· Ecosystem = all the biotic and abiotic components in a particular area, and the interactions between them.
· Biotic factors = living factors, e.g. predation, competition, disease, food availability.
· Abiotic factors = non-living factors, e.g. light intensity, temperature, water availability, pH, soil mineral ions, oxygen concentration.
· Niche = the role of a species in an ecosystem, including where it lives, what it eats, how it interacts with other organisms and its environmental requirements.
· Species with very similar niches are more likely to show interspecific competition.
· A species’ distribution and abundance are affected by both biotic and abiotic factors.
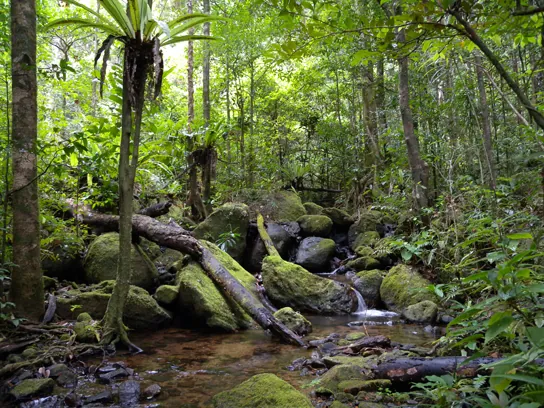
This image illustrates biodiversity at the ecosystem level, showing a habitat with many interacting organisms. It is useful for linking ecosystems, habitats, species diversity and the importance of conserving complex communities. Source
Levels of biodiversity
· Biodiversity = the variety of life in an area.
· Biodiversity can be assessed at different levels:
· Ecosystem diversity = the number and range of different ecosystems and habitats in an area.
· Species diversity = the number of different species and their relative abundance.
· Genetic diversity = the amount of genetic variation within each species.
· High biodiversity usually means: many species, high evenness, varied habitats and high genetic variation.
· Low biodiversity may occur when a habitat is dominated by only one or a few species.
· Species richness = number of different species present.
· Species evenness = how evenly individuals are distributed between species.
· Two habitats can have the same species richness but different species diversity if one is dominated by a single species.
Random sampling
· Random sampling reduces bias when estimating biodiversity.
· Sampling sites should be chosen using a random method, e.g. random number generator or random coordinates on a grid.
· Random sampling improves the reliability of estimates for species distribution, abundance and diversity.
· A larger number of samples usually gives a more representative estimate.
· Sampling must be standardised: same quadrat size, same method, same time period and same identification criteria.
· Results from random samples can be used to estimate total abundance across the whole study area.
· Random sampling is most suitable when the habitat is relatively uniform.
Frame quadrats
· Frame quadrats are used to sample sessile or slow-moving organisms, especially plants.
· Place quadrats randomly to estimate abundance, frequency or percentage cover.
· Density = number of individuals per unit area.
· Frequency = proportion or percentage of quadrats in which a species occurs.
· Percentage cover = estimated percentage of the quadrat covered by a species.
· Use percentage cover when individual organisms are difficult to count separately, e.g. grasses, mosses or algae.
· Avoid bias by placing the quadrat at the selected coordinates without choosing “interesting” areas.
· Use many repeats and calculate a mean to improve reliability.
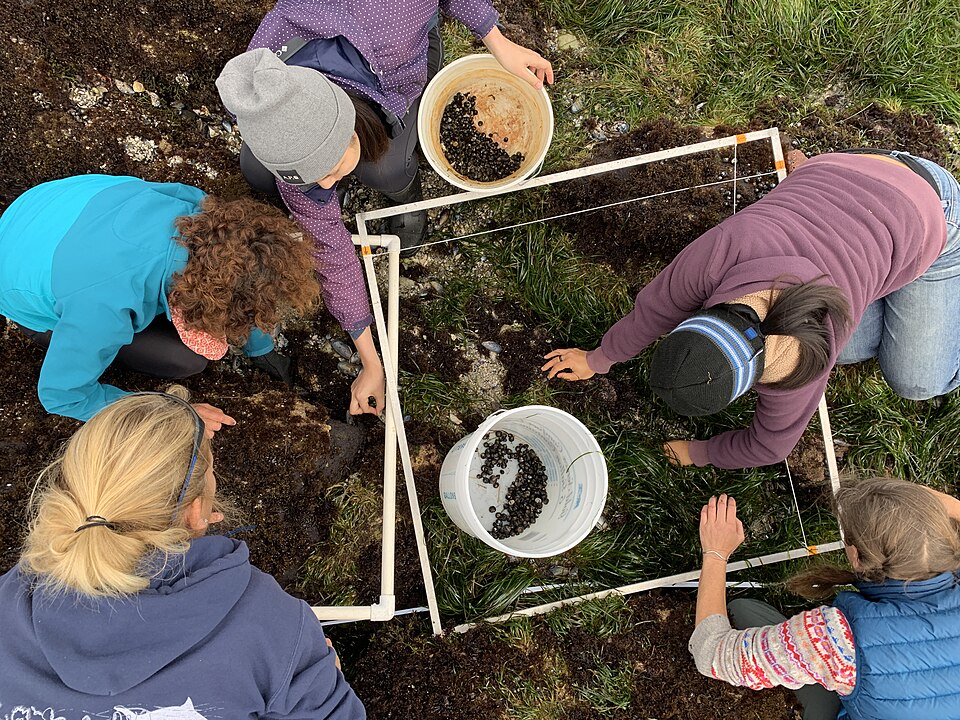
This image shows how a frame quadrat can be placed in a habitat to sample organisms in a defined area. It is useful for visualising how abundance or percentage cover data are collected during biodiversity fieldwork. Source
Line transects and belt transects
· Line transect = a tape or string is placed across a habitat and organisms touching the line are recorded.
· Line transects show how distribution changes along an environmental gradient, e.g. distance from shore, light intensity or soil moisture.
· Belt transect = quadrats are placed at regular intervals along a transect line, or continuously beside the line.
· Belt transects collect more detailed abundance data than line transects.
· Use systematic sampling along a transect when investigating changes across a gradient.
· Measure relevant abiotic factors at the same points as the organisms, e.g. pH, temperature, light intensity or soil moisture.
· Present transect data using tables, kite diagrams, bar charts or scatter graphs, depending on the variables.
Mark-release-recapture and the Lincoln index
· Mark-release-recapture is used for motile animals that cannot be counted directly.
· Method: capture a sample, mark them harmlessly, release them, allow time to mix, capture a second sample, then count marked individuals recaptured.
· Lincoln index estimates population size:
· Population estimate = (number in first sample × number in second sample) ÷ number marked in second sample.
· Assumptions:
· Marks do not fall off or affect survival.
· Marked individuals mix randomly back into the population.
· No births, deaths, immigration or emigration occur between samples.
· The second sample is random.
· Marking does not make individuals more or less likely to be recaptured.
· If few marked individuals are recaptured, the estimated population size is larger.
· Mark-release-recapture is less reliable if the population is very mobile, breeding rapidly or affected by migration.
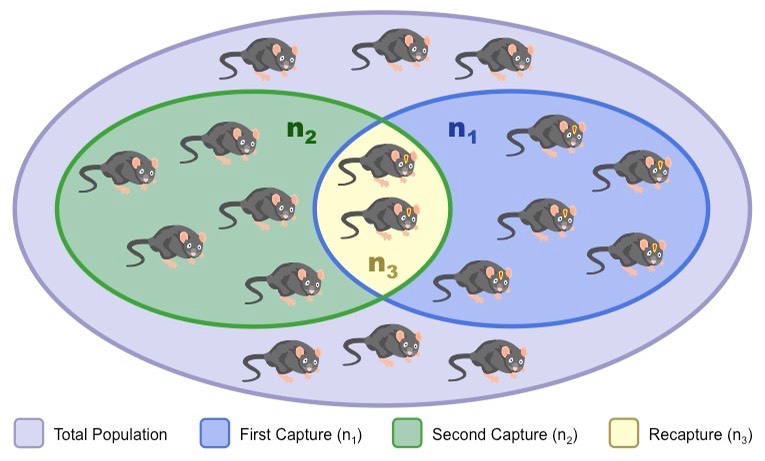
This diagram explains how the Lincoln index estimates population size from two samples. It clearly shows why the number of marked individuals recaptured is used to estimate the size of the total population. Source
Correlation in biodiversity studies
· Correlation tests are used to analyse relationships between two variables, such as an abiotic factor and species abundance.
· Spearman’s rank correlation is used to test for a relationship between two ranked variables.
· Use Spearman’s rank when data are not normally distributed or when the relationship is not necessarily linear.
· Pearson’s linear correlation is used to test for a linear relationship between two continuous variables.
· Use Pearson’s correlation when data are continuous and show an approximately linear relationship.
· Correlation coefficient values range from -1 to +1.
· +1 = perfect positive correlation; -1 = perfect negative correlation; 0 = no correlation.
· Correlation does not prove causation.
· In exams, always link the statistical result back to the biological context, e.g. “as light intensity increases, the abundance of species X increases”.
This scatter graph helps students visualise a relationship between two variables before applying a correlation test. It is useful for interpreting whether biotic or abiotic factors may be associated with changes in species abundance. Source
Simpson’s index of diversity
· Simpson’s index of diversity (D) measures biodiversity using both species richness and species evenness.
· It gives a numerical estimate of biodiversity in a habitat.
· A higher value of D indicates greater biodiversity.
· A habitat with many species and similar numbers of individuals in each species has high D.
· A habitat dominated by one species has lower D, even if several species are present.
· Exam formula is provided, but you must know how to substitute values correctly.
· Typical method: count individuals of each species, calculate totals, substitute into the formula, then interpret the value.
· When comparing habitats, the habitat with the larger D value has greater biodiversity.
· Always state that D depends on both the number of species and the relative abundance of each species.
Exam technique: biodiversity calculations and interpretation
· For quadrat data, calculate a mean per quadrat, then scale up to estimate the total population in the whole area.
· For percentage cover, use consistent visual estimates or grids to reduce subjectivity.
· For transects, describe both the pattern and the possible biotic/abiotic factor causing the pattern.
· For Lincoln index questions, check that the recaptured marked number is in the denominator.
· For Simpson’s index questions, organise data carefully by species before substituting into the formula.
· For correlation questions, identify the correct test: Spearman’s rank for ranked/non-parametric data; Pearson’s for linear continuous data.
· Use the correct biological wording: distribution = where organisms are found; abundance = how many organisms are present.
· In interpretation questions, include comparative language such as higher, lower, greater diversity, more even, dominant species or positive correlation.
Checklist: can you do this?
· Define ecosystem, niche and the three levels of biodiversity.
· Explain why random sampling is important when assessing biodiversity.
· Choose and describe suitable sampling methods: frame quadrats, line transects, belt transects and mark-release-recapture.
· Use and interpret Lincoln index, Simpson’s index of diversity, Spearman’s rank correlation and Pearson’s linear correlation.
· Explain how biotic and abiotic factors affect the distribution and abundance of species.