Enzymes as biological catalysts
· Enzymes are globular proteins that act as biological catalysts.
· They increase the rate of reaction by lowering activation energy.
· Enzymes are not used up and remain unchanged at the end of the reaction.
· Intracellular enzymes catalyse reactions inside cells.
· Extracellular enzymes are secreted and catalyse reactions outside cells.
· Exam phrase: enzymes have a specific 3D tertiary structure that forms an active site.
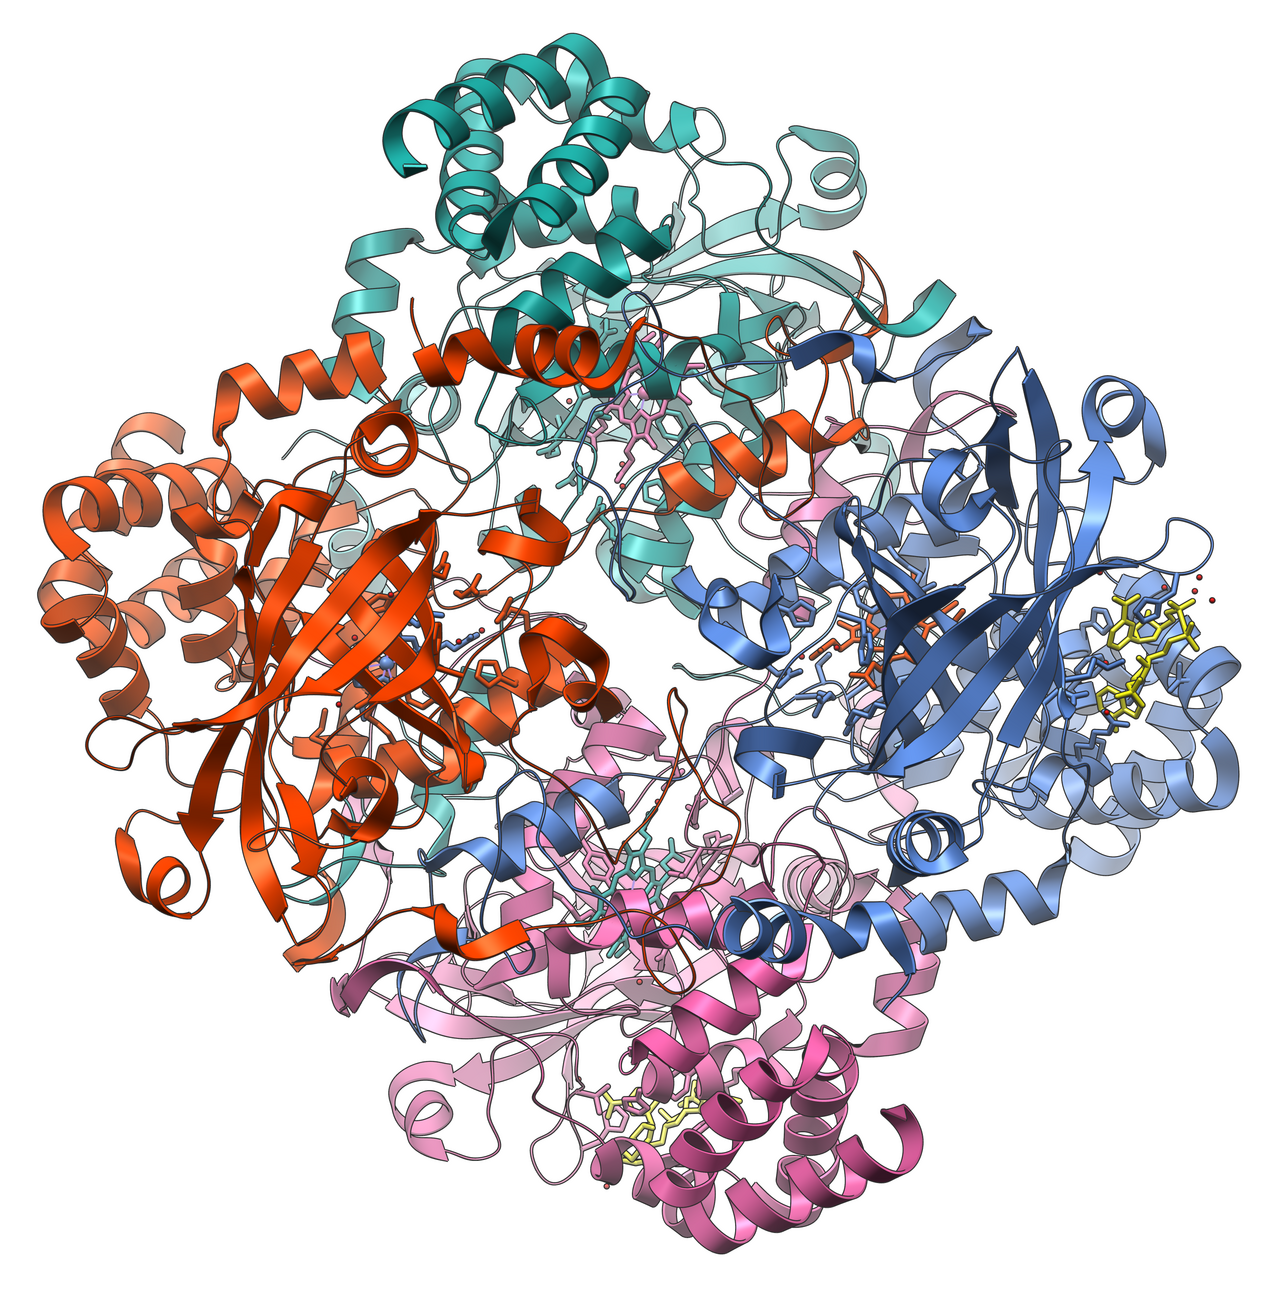
Catalase is an example of a globular enzyme. Its folded 3D structure creates specific active sites, allowing it to catalyse the breakdown of hydrogen peroxide. Source
Active site, substrate and enzyme-substrate complex
· The active site is the region of the enzyme where the substrate binds.
· The substrate is the reactant acted on by the enzyme.
· The active site has a specific shape and chemical properties complementary to the substrate.
· When the substrate binds, an enzyme-substrate complex forms.
· The reaction occurs while the substrate is bound, then products leave the active site.
· The enzyme can then catalyse another reaction.
Lowering activation energy
· Activation energy is the minimum energy needed for a reaction to start.
· Enzymes lower activation energy, so more substrate molecules have enough energy to react.
· This increases the rate of reaction without changing the enzyme permanently.
· Enzymes may lower activation energy by holding substrates in the correct position, stressing bonds, or creating a favourable microenvironment at the active site.
· Exam phrase: enzymes provide an alternative reaction pathway with lower activation energy.
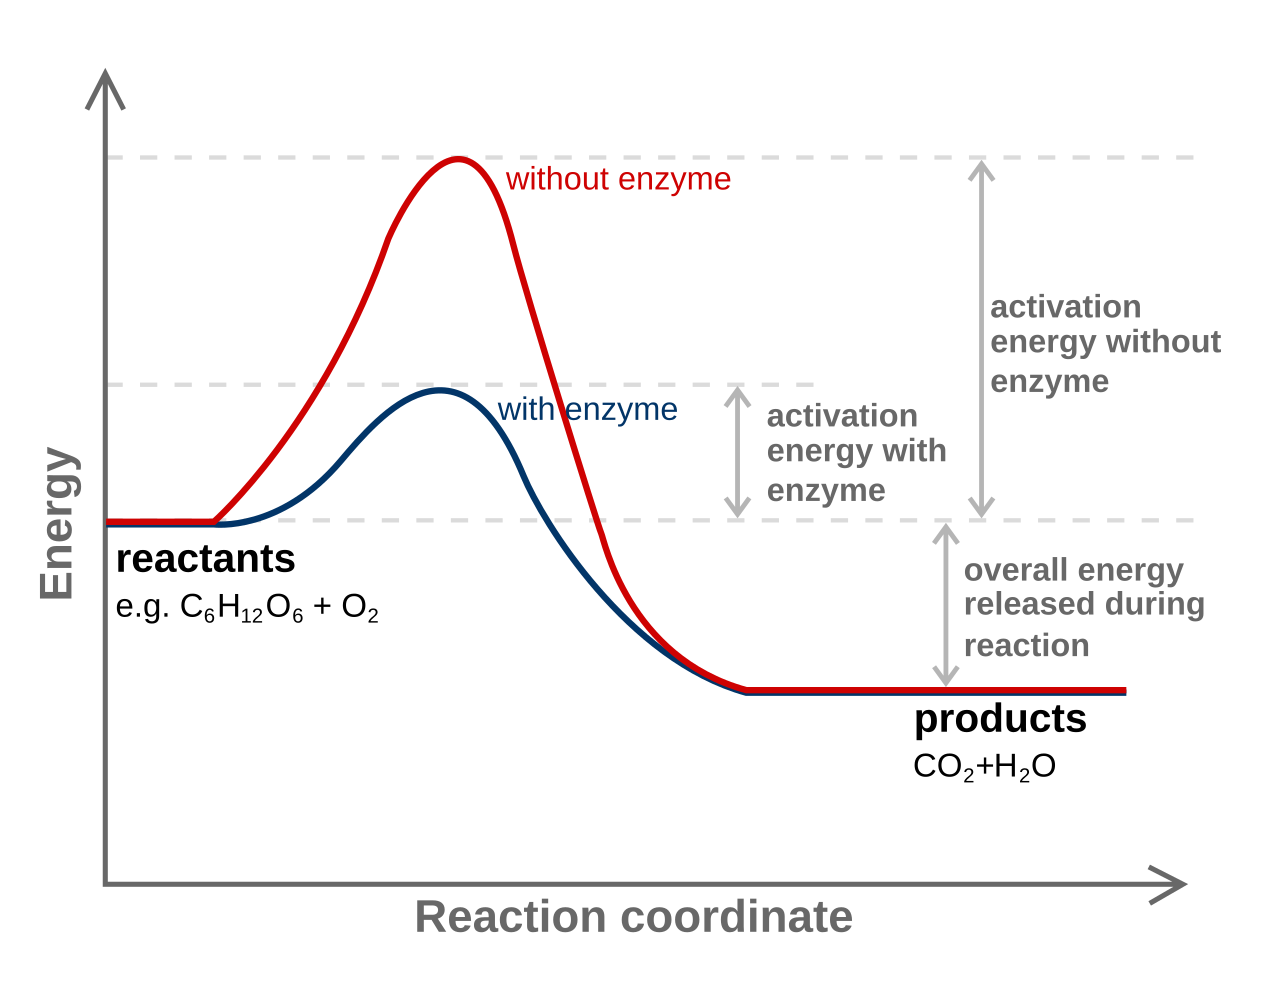
The graph shows that an enzyme-catalysed reaction has a lower activation energy than an uncatalysed reaction. This explains why enzymes increase reaction rate. Source
Enzyme specificity
· Enzymes are specific because only certain substrates can bind to their active site.
· Specificity depends on the shape, charge and chemical properties of the active site.
· A change in the enzyme’s tertiary structure may alter the active site and reduce enzyme activity.
· Each enzyme usually catalyses one reaction or a small group of closely related reactions.
· Exam phrase: the substrate is complementary to the enzyme’s active site.
Lock-and-key hypothesis
· The lock-and-key hypothesis states that the enzyme’s active site is a fixed shape.
· The substrate fits exactly into the active site, like a key fitting a lock.
· This explains enzyme specificity because only the correct substrate fits.
· Limitation: it does not fully explain how the active site may change shape during binding.
Induced-fit hypothesis
· The induced-fit hypothesis states that the active site is flexible, not completely fixed.
· When the substrate binds, the enzyme changes shape slightly to fit the substrate more closely.
· This produces a tighter enzyme-substrate complex.
· The shape change helps lower activation energy and improves catalysis.
· Exam phrase: substrate binding causes a conformational change in the active site.
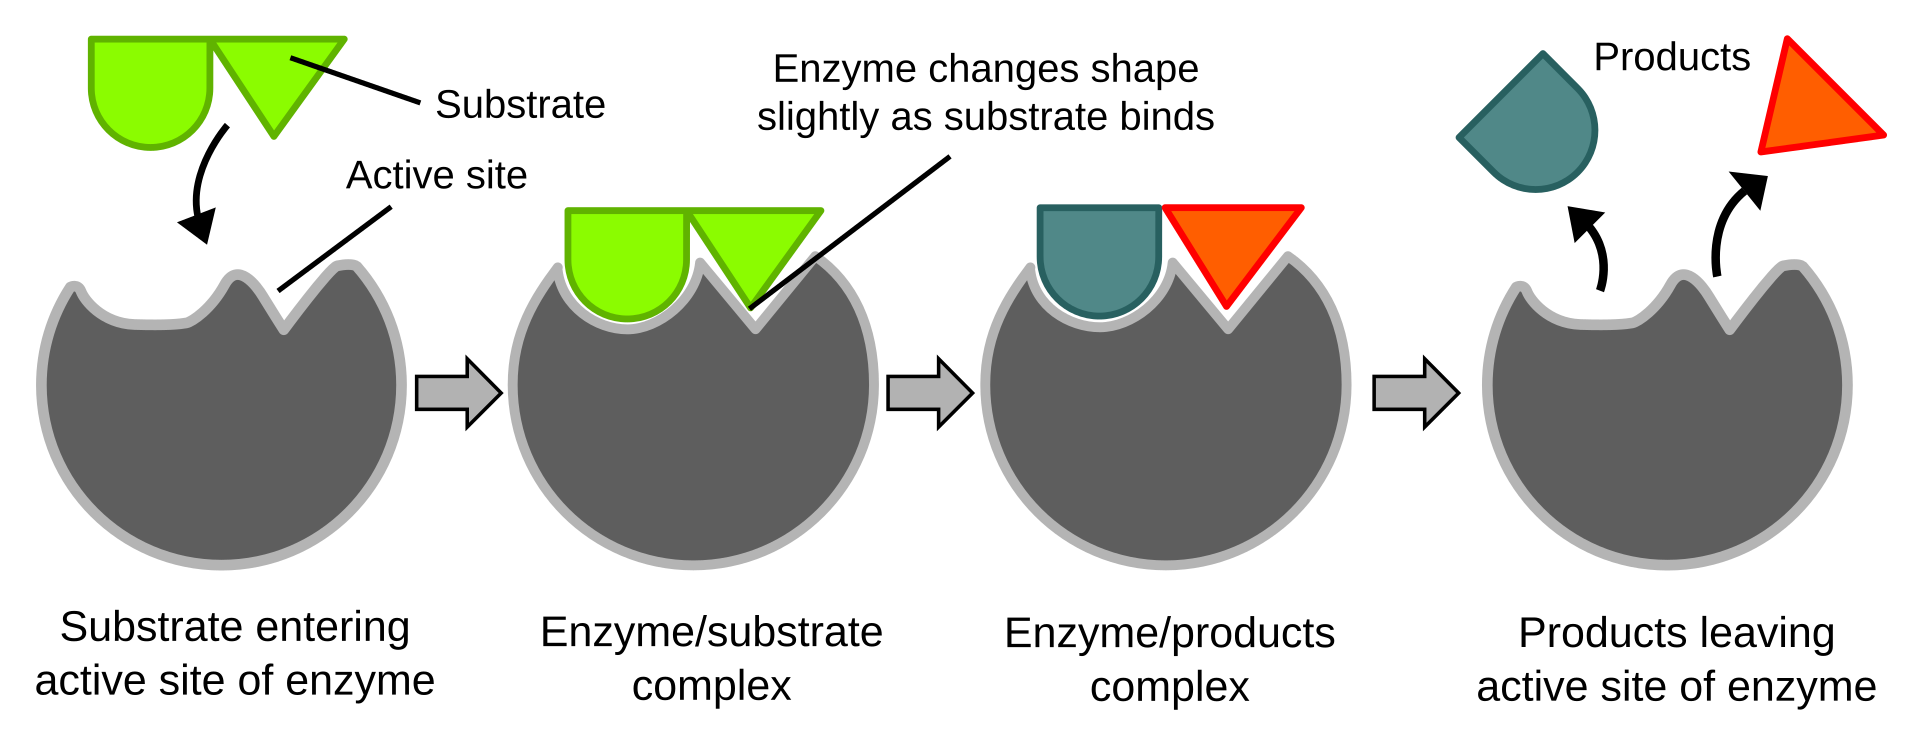
This diagram shows the induced-fit model of enzyme action. The enzyme changes shape as the substrate binds, forming a more effective enzyme-substrate complex. Source
Investigating catalase: rate of product formation
· Catalase breaks down hydrogen peroxide into water and oxygen.
· Word equation: hydrogen peroxide → water + oxygen.
· The rate of product formation can be measured by collecting oxygen gas over time.
· Possible method: use a gas syringe or measure oxygen bubbles/foam height over a fixed time.
· Keep key variables controlled: temperature, pH, enzyme concentration, substrate concentration and volume.
· Calculate rate using: rate = amount of oxygen produced ÷ time.
· For initial rate, use the steepest early part of the product-time graph.
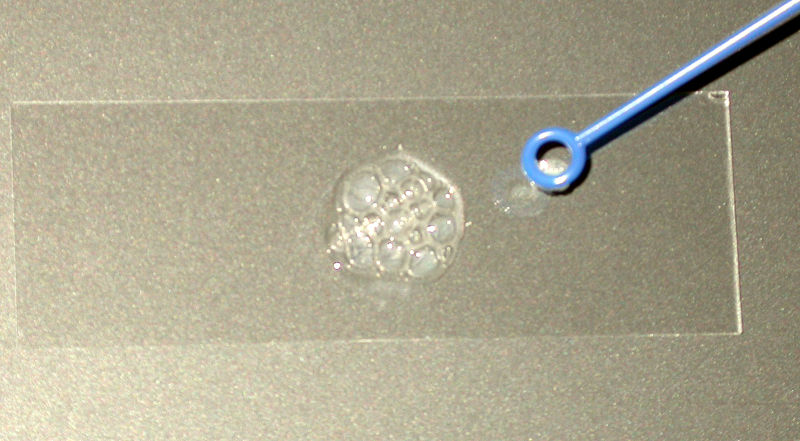
Catalase produces oxygen gas when it breaks down hydrogen peroxide. Measuring oxygen produced per unit time gives the rate of product formation. Source
Investigating amylase: rate of substrate disappearance
· Amylase hydrolyses starch into smaller sugars such as maltose.
· The rate of substrate disappearance can be followed using the iodine test for starch.
· Iodine turns blue-black when starch is present.
· As amylase digests starch, the iodine test eventually remains orange-brown, showing starch has disappeared.
· Common method: take samples at timed intervals and add to iodine on a spotting tile.
· Rate can be estimated using: rate = 1 ÷ time taken for starch to disappear.
· Keep variables controlled: temperature, pH, amylase concentration, starch concentration and sample volume.
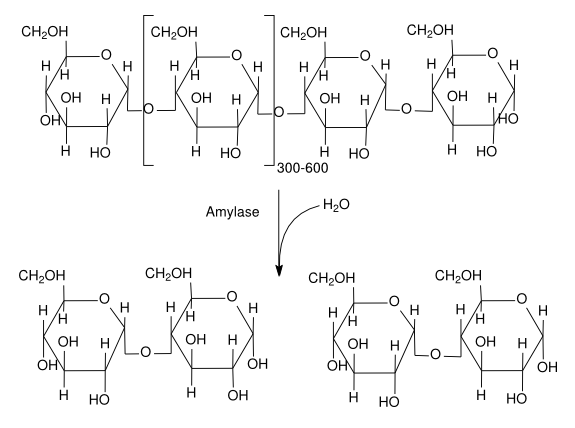
This diagram shows amylase breaking down starch/amylose into smaller sugar molecules. It links directly to using iodine to monitor the disappearance of starch. Source
Using a colorimeter in enzyme investigations
· A colorimeter measures absorbance or transmission of light through a coloured solution.
· It is useful when an enzyme-catalysed reaction involves a colour change.
· Set up using a suitable filter/wavelength for the colour being measured.
· Use a blank to zero/calibrate the colorimeter before taking readings.
· Measure absorbance at regular time intervals to follow reaction progress.
· Increasing or decreasing absorbance can indicate increasing product formation or decreasing substrate concentration, depending on the reaction.
· A graph of absorbance against time can be used to estimate rate of reaction.
A cuvette holds the reaction mixture in a colorimeter or spectrophotometer. The instrument measures how much light is absorbed, allowing colour change to be tracked quantitatively. Source
Exam graph skills for enzyme-catalysed reactions
· A product-time graph usually rises steeply at first, then levels off as substrate becomes limiting.
· The initial rate is found from the gradient at the start of the graph.
· A substrate-time graph usually decreases as substrate is used up.
· A faster reaction has a steeper gradient.
· When comparing experiments, use the same units, controlled variables and time interval.
Checklist: can you do this?
· Define enzyme, active site, substrate, enzyme-substrate complex and activation energy.
· Explain enzyme action using specificity, lock-and-key hypothesis and induced-fit hypothesis.
· Describe how enzymes lower activation energy and increase rate of reaction.
· Explain how to measure enzyme rate using catalase product formation and amylase substrate disappearance.
· Outline how a colorimeter can monitor enzyme-catalysed reactions involving colour changes.