Core ideas
Chemical reactions and physical changes involve energy transfer between the system and the surroundings.
Total energy is conserved: energy is not created or destroyed, only transferred.
System = the chemicals/process being studied. Surroundings = everything outside the system.
Heat is energy transferred because of a temperature difference.
Temperature is a measure of the average kinetic energy of particles.
Do not confuse heat with temperature: a substance can gain/lose heat energy and show a temperature change, but they are not the same quantity.
Endothermic vs exothermic
Endothermic reaction: energy is transferred from the surroundings to the system.
In an endothermic process, the temperature of the surroundings decreases.
Exothermic reaction: energy is transferred from the system to the surroundings.
In an exothermic process, the temperature of the surroundings increases.
Exam link: if the measured temperature rises, the reaction is usually exothermic; if the measured temperature falls, it is usually endothermic.
Sign convention:
Exothermic:
Endothermic:
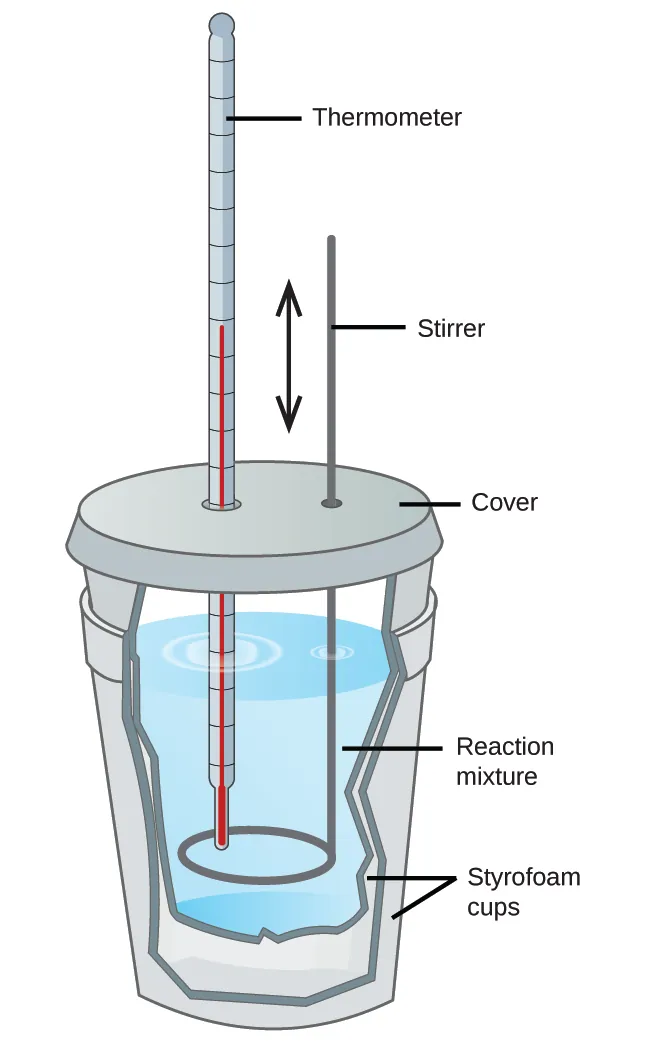
This diagram shows a coffee-cup calorimeter, the standard school setup for measuring enthalpy changes at constant pressure. It helps you visualize which parts reduce heat loss and where the temperature change is measured. Source
Relative stability and enthalpy change
Whether a reaction is endothermic or exothermic depends on the relative stability of reactants and products.
More stable species have lower potential energy.
If products are lower in energy than reactants, energy is released and the reaction is exothermic.
If products are higher in energy than reactants, energy is absorbed and the reaction is endothermic.
On an energy profile:
y-axis = potential energy
x-axis = reaction coordinate
Energy profile diagrams
Exothermic profile:
Reactants start at higher potential energy than products.
is negative.
Endothermic profile:
Products end at higher potential energy than reactants.
is positive.
Always check:
relative heights of reactants and products
sign of
correct axis labels: reaction coordinate and potential energy
A common exam error is mixing up activation energy with enthalpy change — in this topic, focus on overall energy difference between reactants and products.
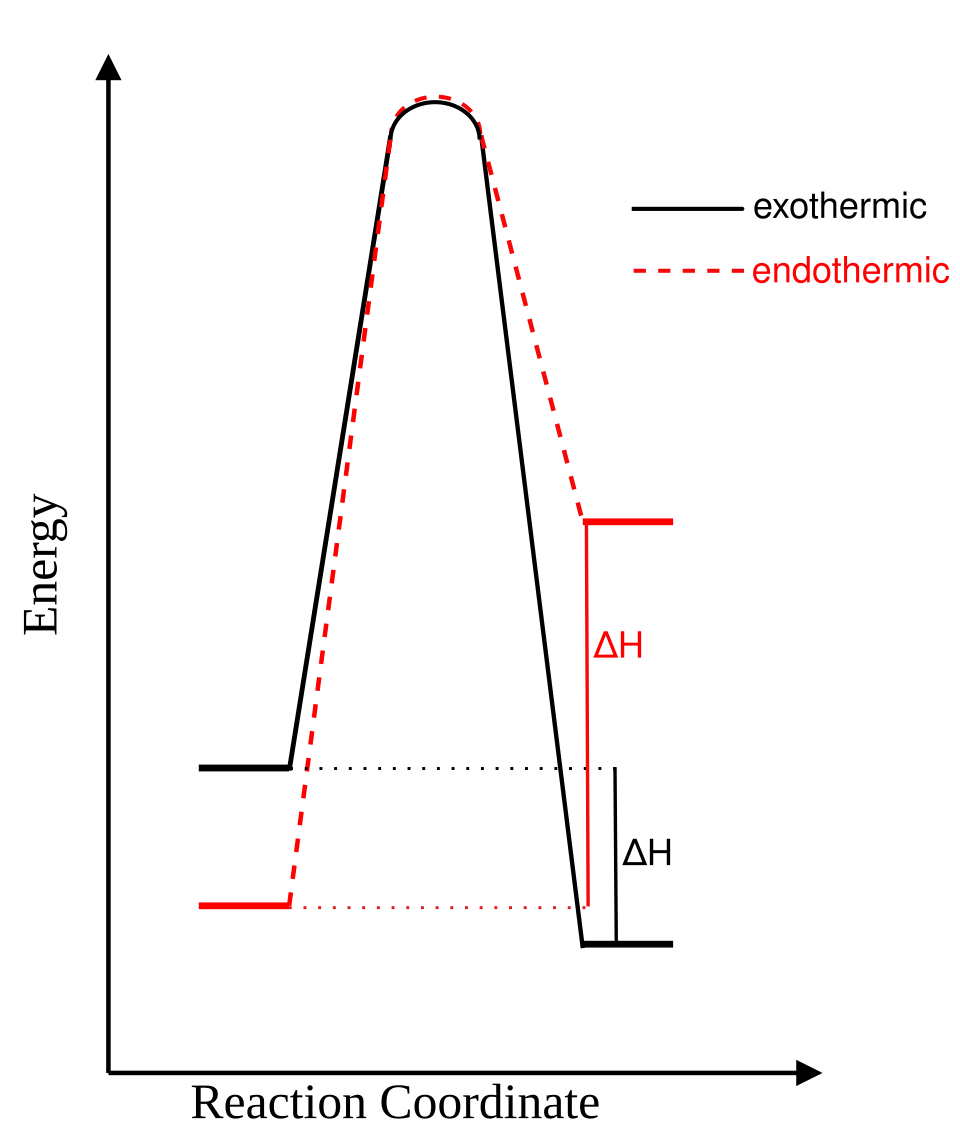
This image compares exothermic and endothermic energy profiles side by side. It is useful for spotting the direction of and comparing the relative energies of reactants and products. Source
Standard enthalpy change and conditions
Standard enthalpy change, , is the heat transferred at constant pressure under standard conditions and standard states.
In this topic, you calculate enthalpy change from the temperature change of a pure substance or solution during an experiment.
Unit of : kJ mol.
In calorimetry questions, the measured temperature change is usually used to find , then converted to enthalpy change per mole.
Calorimetry and measuring enthalpy changes
Calorimetry measures heat transferred by recording a temperature change.
Typical school method: measure temperature before and after a reaction in an insulated container.
Assume the solution behaves like water unless told otherwise.
Key idea:
if the water/solution gains heat, the reaction loses heat
if the water/solution loses heat, the reaction gains heat
This is why the equation for reaction enthalpy includes a negative sign.
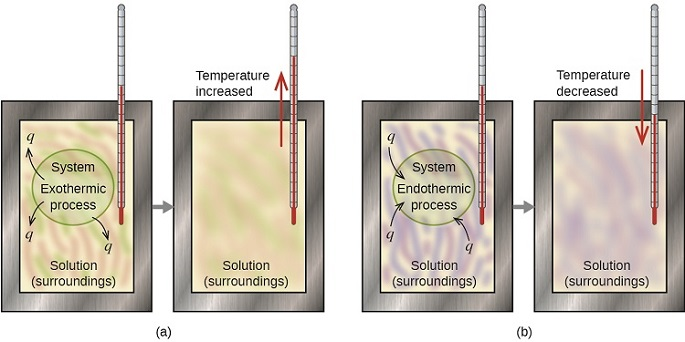
These diagrams show how heat flows in exothermic and endothermic processes inside a calorimeter. They are helpful for linking temperature change, sign of , and the direction of energy transfer between system and surroundings. Source
Required equations
Meanings:
= heat energy transferred
= mass of substance heated/cooled
= specific heat capacity
= temperature change
= amount of reacting substance in mol
For water, is given in the data booklet.
Unit check:
usually first found in J
convert to kJ before finding in kJ mol if needed
How to calculate enthalpy change in exam questions
Step 1: Find .
Step 2: Calculate using .
Step 3: Decide which substance the mass refers to, usually the water/solution.
Step 4: Convert from J to kJ if needed.
Step 5: Find moles, , of the substance asked for in the question.
Step 6: Use .
Step 7: Add the correct sign and units: kJ mol.
Sign conventions and exam traps
If temperature increases, then is positive, for the water/solution is positive, so for the reaction is negative.
If temperature decreases, then is negative, for the water/solution is negative, so for the reaction is positive.
Always be clear whether refers to the surroundings or the reaction.
The reaction enthalpy is usually the opposite sign to the heat change of the water/solution.
Use the amount in moles of the limiting/reacting substance named in the question, not automatically the mass of solution.
Do not forget unit conversion from cm to g if density is assumed to be 1.0 g cm for aqueous solutions.
Practical method and sources of error
In school calorimetry, the measured temperature change is often smaller than the theoretical value.
Main reasons:
heat lost to the surroundings
heat absorbed by the apparatus
incomplete combustion or incomplete reaction
evaporation or delayed temperature reading
Therefore, experimental values for enthalpy change are often less exothermic or less endothermic than theoretical values.
Practical improvements:
use a lid
improve insulation
stir thoroughly
measure temperature quickly and carefully
use accurate masses/volumes

This diagram shows multiple enthalpy steps adding up to an overall exothermic enthalpy change. It is useful for understanding that enthalpy diagrams can represent energy stages and not just a single up/down arrow. Source
Checklist: can you do this?
Distinguish clearly between heat and temperature.
Identify whether a reaction is endothermic or exothermic from temperature change, energy transfer, or the sign of .
Sketch and interpret energy profile diagrams with correctly labelled axes.
Apply and correctly, including units and sign.
Explain why calorimetry results often differ from theoretical values.