Economics as a social science
· Economics = the study of how individuals, firms, governments, and societies make choices about using limited resources to satisfy unlimited wants and needs.
· It is a social science because it studies human behaviour, decision-making, and the consequences of choices in the real world.
· Two core branches:
· Microeconomics = studies individual decision-makers and specific markets, such as consumers, firms, and prices.
· Macroeconomics = studies the economy as a whole, such as economic growth, inflation, unemployment, and government policy.
· The nine central concepts introduced in IB Economics are: scarcity, choice, efficiency, equity, economic well-being, sustainability, change, interdependence, and intervention.
· Exam link: always connect theory to real-world decision-makers and the effects on well-being.
The problem of choice: scarcity, needs, wants, and factors of production
· Scarcity exists because resources are limited but human wants and needs are unlimited.
· Because of scarcity, every society must make choices about how resources are allocated.
· Factors of production (FOPs) are the resources used to produce goods and services:
· Land = all natural resources.
· Labour = human effort used in production.
· Capital = man-made aids to production, such as machinery and tools.
· Entrepreneurship = the ability to organise resources, take risks, and make business decisions.
· Needs are essentials for survival; wants are things people would like to have. In exams, the key point is that both place pressure on scarce resources.
· Scarcity and sustainability are linked: using finite resources unsustainably can reduce future production possibilities and future economic well-being.
· Free goods are goods with no opportunity cost because they are available in abundance in a given context, for example air in most situations. A good can stop being a free good if it becomes scarce.
Opportunity cost
· Opportunity cost = the value of the next best alternative foregone when a choice is made.
· It is the true cost of any decision, not just the money spent.
· Example: if a government spends more on healthcare, the opportunity cost may be less spending on education or infrastructure.
· Exam tip: when explaining choice, always identify what is sacrificed.
· In diagrams and data questions, opportunity cost often appears as:
· the amount of one good given up to gain more of another
· the movement from one point to another on a PPC.
The basic economic questions
· Because of scarcity, every economy must answer three basic economic questions:
· What (and how much) to produce?
· How to produce?
· For whom to produce?
· These questions are about resource allocation.
· Market economies mainly answer them through the price mechanism and private decision-making.
· Planned economies mainly answer them through government decisions.
· Mixed economies use both market forces and government intervention.
· Exam tip: when comparing systems, focus on who makes the decisions and the extent of government intervention.
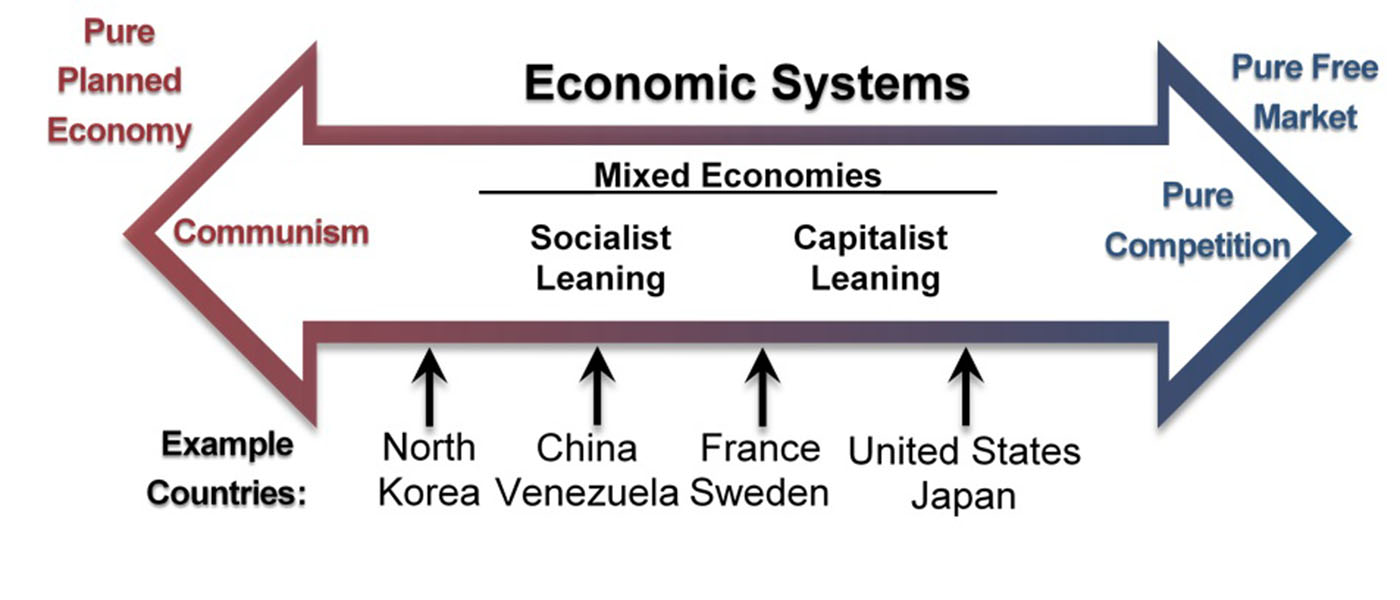
This diagram shows a continuum of economic systems from planned to free market, with mixed economies in between. It is useful for remembering that most real economies are not pure systems. In IB answers, use it to explain different ways societies answer the basic economic questions. Source
Means of answering the economic questions
· Market versus government intervention is the key issue.
· In a free market economy, prices, profit motive, and consumer demand largely decide resource allocation.
· In a planned economy, the government owns or controls many resources and decides output and distribution.
· In a mixed economy, both private sector decisions and government policies influence outcomes.
· No real economy is purely market or purely planned; most are mixed economies.
· Evaluation angle: economists debate which system better achieves efficiency, equity, sustainability, and economic well-being.
The production possibilities curve (PPC)
· The production possibilities curve (PPC) shows the maximum combinations of two goods or services that can be produced using available resources and technology, when resources are used fully and efficiently.
· Main assumptions of the model:
· only two products are shown
· resources are fixed in quantity and quality
· technology is fixed
· resources are fully employed unless shown otherwise
· The PPC illustrates:
· Scarcity = points outside the curve are unattainable now
· Choice = moving along the curve means choosing between combinations
· Opportunity cost = gaining more of one good means sacrificing some of the other
· Efficiency = points on the curve
· Unemployment / underemployment of resources = points inside the curve
· Actual growth = movement from a point inside the PPC to a point on the PPC, showing better use of existing resources.
· Growth in production possibilities = an outward shift of the PPC caused by more or better resources, or improved technology.
· Constant opportunity cost gives a straight-line PPC.
· Increasing opportunity cost gives a concave PPC because resources are not equally suited to producing both goods.
· Exam tip: always label axes, show key points clearly, and explain whether a movement is inside to curve, along the curve, or an outward shift.
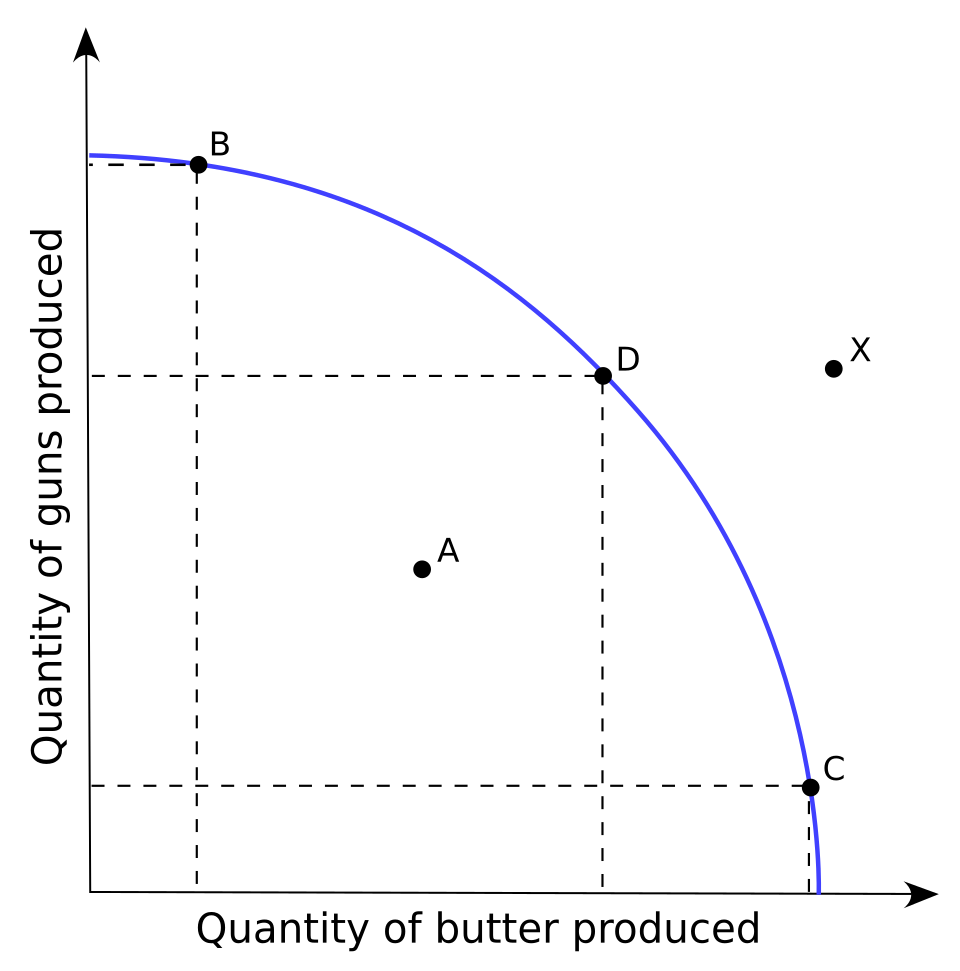
This diagram shows the PPC/PPF with points that are efficient, inefficient, and unattainable. It is ideal for revising how the curve illustrates scarcity, choice, and opportunity cost. Use it to practise explaining movements, points inside the curve, and outward shifts for economic growth. Source
Modelling the economy: circular flow of income
· The circular flow of income model shows how income, output, and spending move between different economic agents in the economy.
· Key decision-makers include: households, firms, government, banks/financial sector, and the foreign sector.
· In the basic model:
· Households supply factors of production to firms
· Firms pay households income
· Households spend income on goods and services
· Firms receive revenue from this spending
· This shows interdependence: one group’s spending is another group’s income.
· Leakages are withdrawals from the circular flow, such as saving, taxation, and imports.
· Injections are additions to the circular flow, such as investment, government spending, and exports.
· Exam tip: if asked to interpret the model, explain both the real flow (resources and goods/services) and the money flow (income and expenditure).
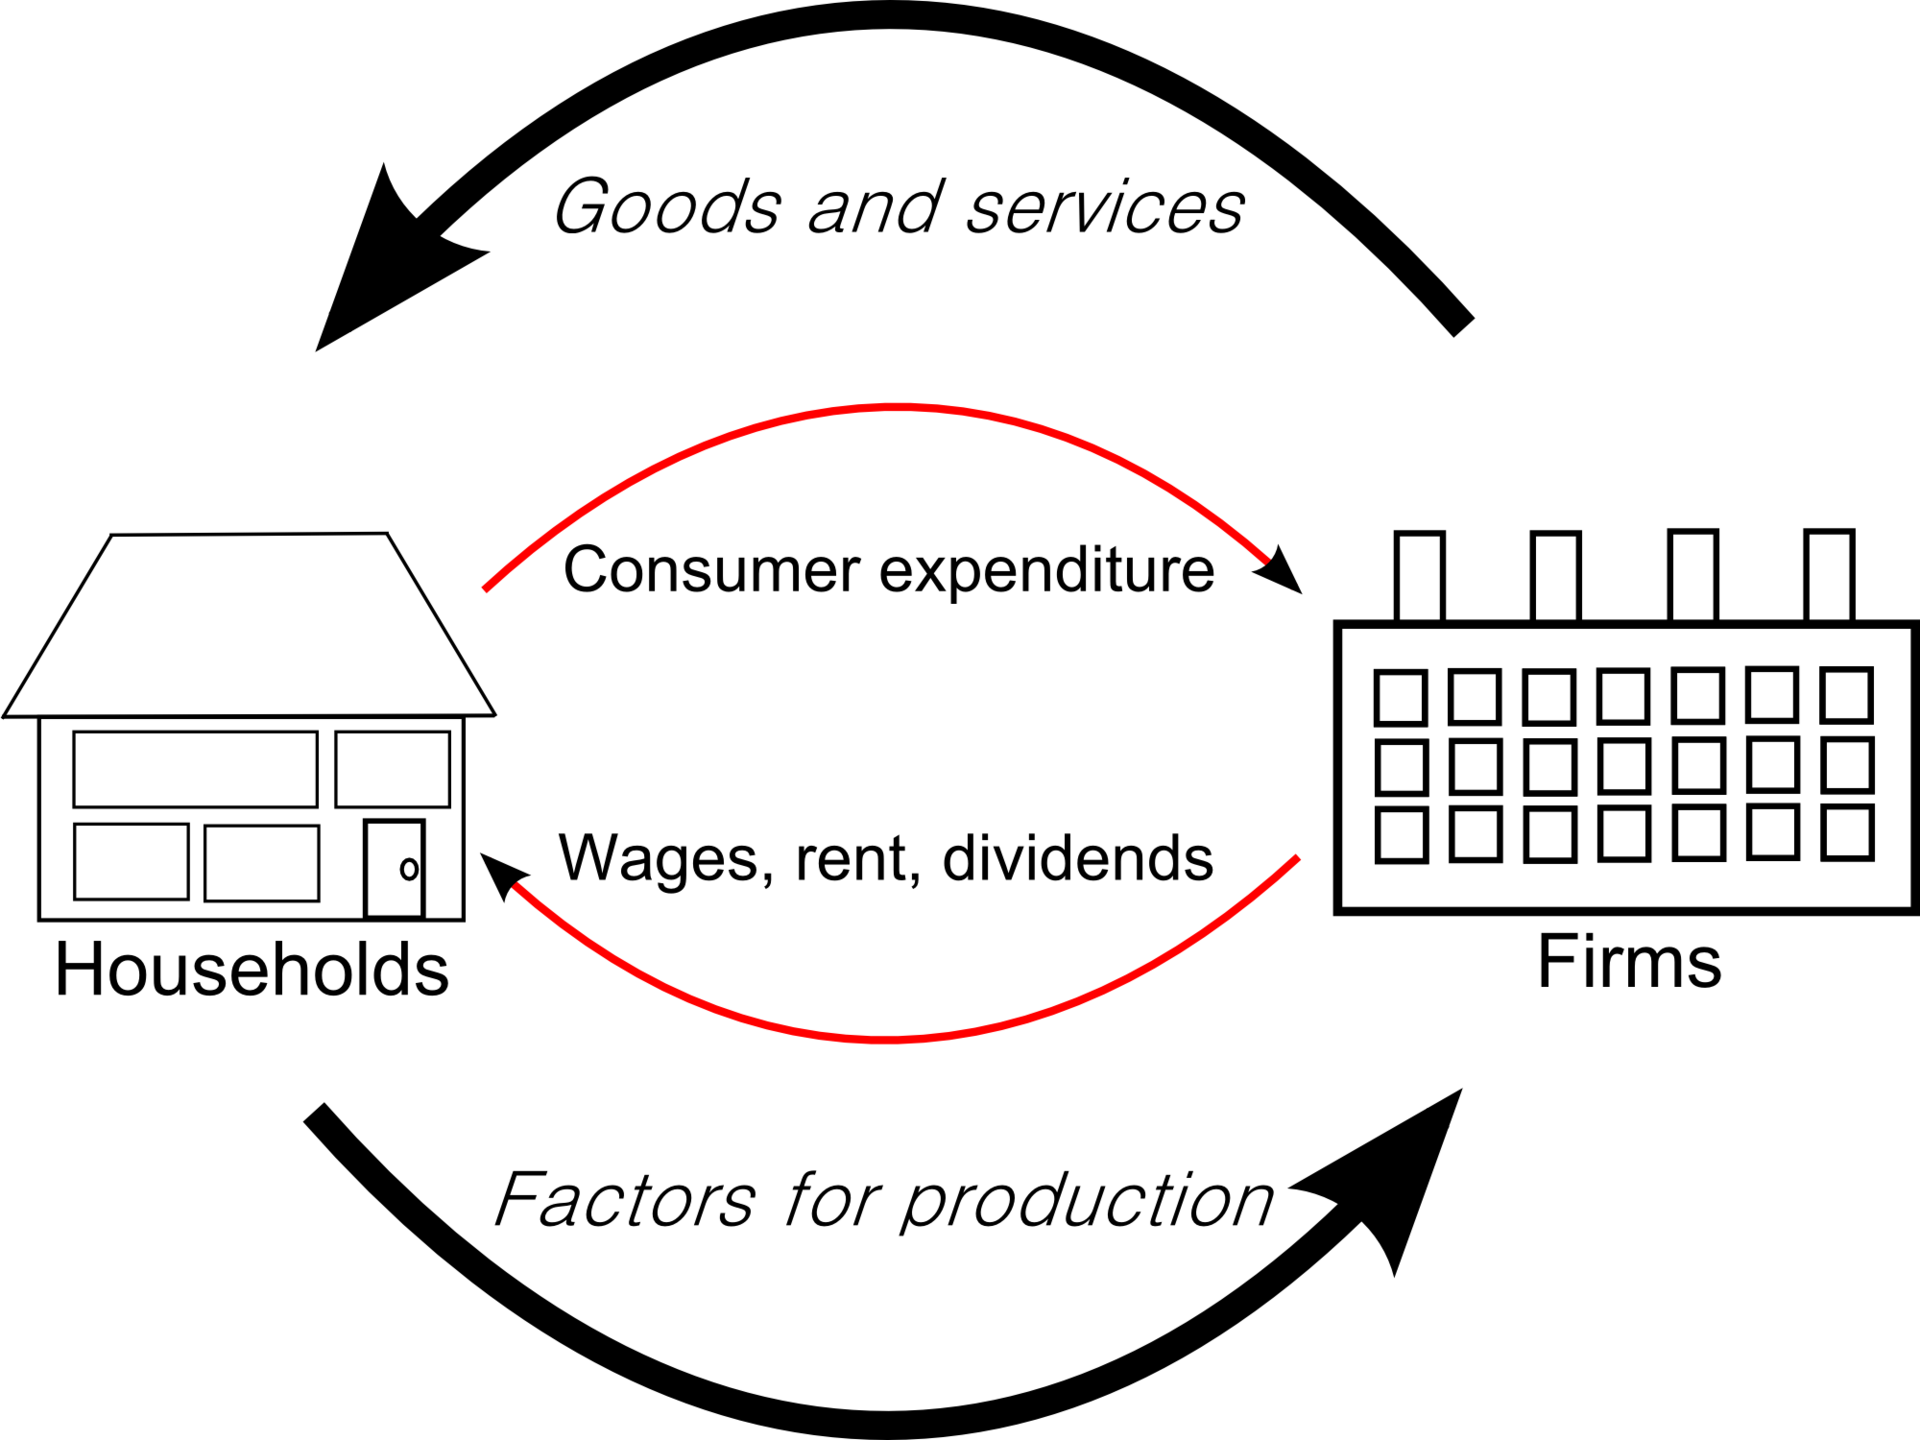
This diagram shows how households and firms are linked through the product market and factor market. It helps you explain interdependence and the two-way movement of real resources and money. Extend it in IB Economics by adding leakages and injections such as saving, investment, taxes, government spending, imports, and exports. Source
What examiners want you to say clearly
· Economics is about choice under scarcity.
· Opportunity cost should be stated as the next best alternative foregone.
· PPC is a model of maximum possible output with given resources and technology.
· Points on the PPC = productive efficiency; points inside = unemployment / inefficiency; points outside = currently unattainable.
· Outward shift of the PPC = economic growth or increased production capacity.
· Circular flow shows interdependence between sectors and helps explain how spending and income move around the economy.
· When writing extended responses, link concepts to efficiency, equity, sustainability, and economic well-being where relevant.
Checklist: can you do this?
· Define scarcity, opportunity cost, free goods, and the four factors of production accurately.
· Explain the three basic economic questions and how market, planned, and mixed economies answer them.
· Draw, label, and interpret a PPC showing choice, opportunity cost, efficiency, unemployment of resources, actual growth, and growth in production possibilities.
· Distinguish between constant and increasing opportunity cost using the shape of the PPC.
· Interpret a circular flow of income diagram, including leakages and injections.