HL only: Market failure—market power
· Market power = ability of a firm to influence price, output, or other market conditions.
· Perfect competition has no market power; firms are price takers.
· Imperfect competition means firms have some degree of market power and are price makers.
· Core exam idea: more market power often means higher prices, lower output, less allocative efficiency, and welfare loss compared with perfect competition.
Market structures: essential features
· Perfect competition: many firms, free entry, homogeneous products.
· Monopoly: single or dominant firm, high barriers to entry, no close substitutes.
· Oligopoly: few large firms, high barriers to entry, interdependence.
· Monopolistic competition: many firms, free entry, product differentiation.
· Exam tip: when asked to identify a market structure, focus on number of firms, entry barriers, nature of product, and degree of market power.
Rational producer behaviour and profit maximization
· Firms are assumed to aim for profit maximization.
· Profit can be written as .
· The profit-maximizing rule is .
· Abnormal profit: .
· Normal profit: .
· Losses: .
· In data questions, be ready to calculate profit, , , , and .
· Do not confuse profit maximization with revenue maximization.
Perfect competition: price taker and efficiency
· A perfectly competitive firm is a price taker because no single firm can influence market price.
· For the firm: .
· In the short run, a perfectly competitive firm may make abnormal profit, normal profit, or losses.
· In the long run, free entry and exit push firms toward normal profit.
· Allocative efficiency occurs when or .
· At this point, social/community surplus is maximized.
· This is the benchmark used to judge the inefficiency of other market structures.
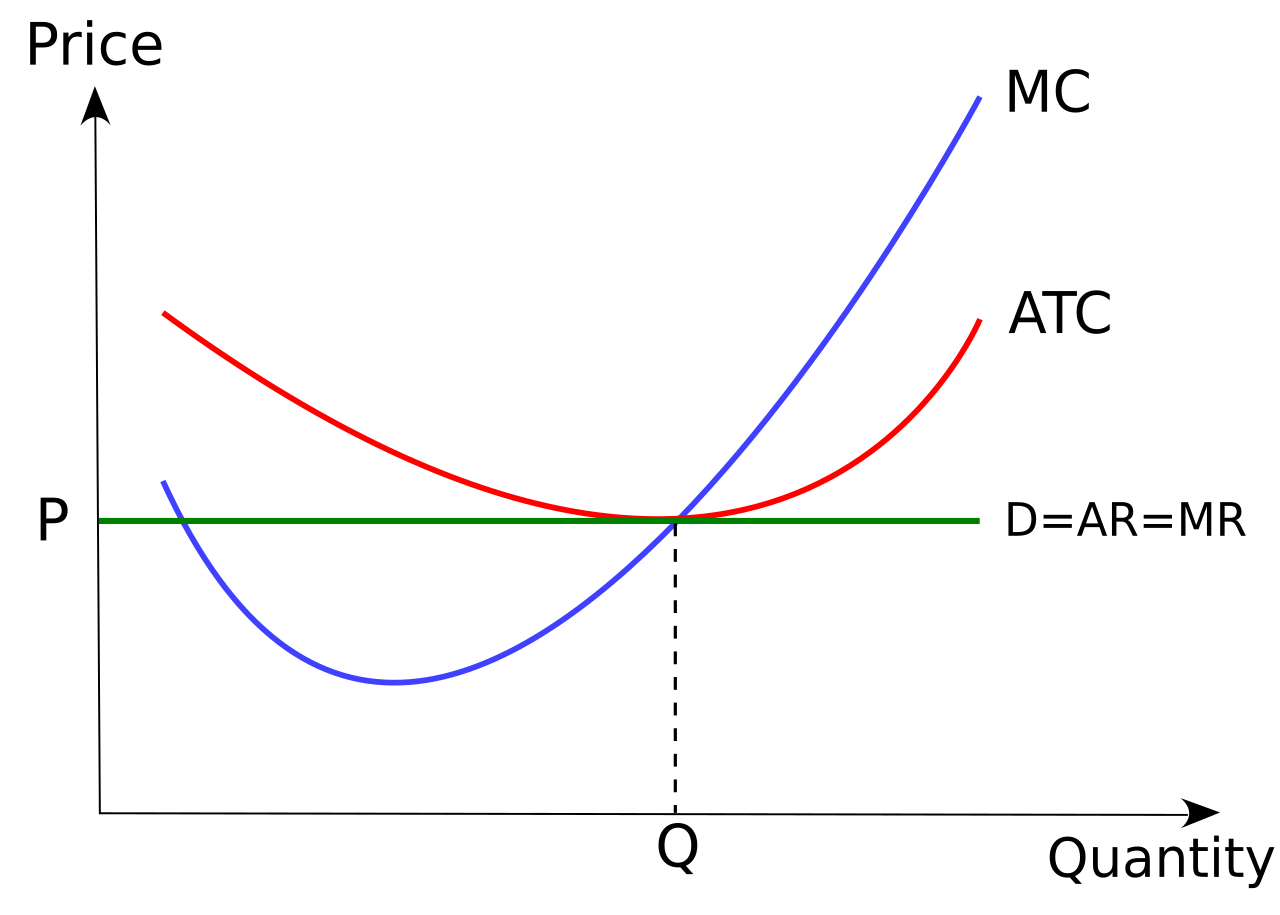
This diagram shows a perfectly competitive firm in long-run equilibrium. It is useful for revising why firms are price takers and why long-run equilibrium is linked to normal profit and allocative efficiency. Source
Monopoly: why it creates market failure
· A monopoly has significant market power.
· The monopolist is a price maker and faces the market demand curve.
· It chooses output where , then charges the price from the AR (demand) curve.
· Compared with perfect competition, monopoly leads to restricted output and a higher price.
· This creates allocative inefficiency and welfare loss.
· Key comparison: monopoly output is lower and monopoly price is higher than under perfect competition.
· A monopoly may earn abnormal profit, normal profit, or losses depending on costs and demand.
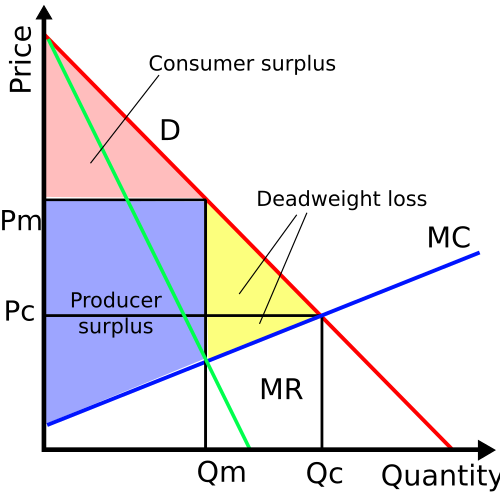
This image shows how a monopoly reduces output and raises price, creating deadweight loss / welfare loss. It is especially helpful for linking market power to allocative inefficiency in exam diagrams. Source
Natural monopoly
· A natural monopoly exists when one firm can supply the market at lower cost than multiple firms.
· This is linked to large economies of scale.
· In evaluation, natural monopolies may be more efficient in production, but they still create concern over price, output, and possible consumer exploitation if unregulated.
· Utilities are commonly used as examples, but only use examples if they fit the question.
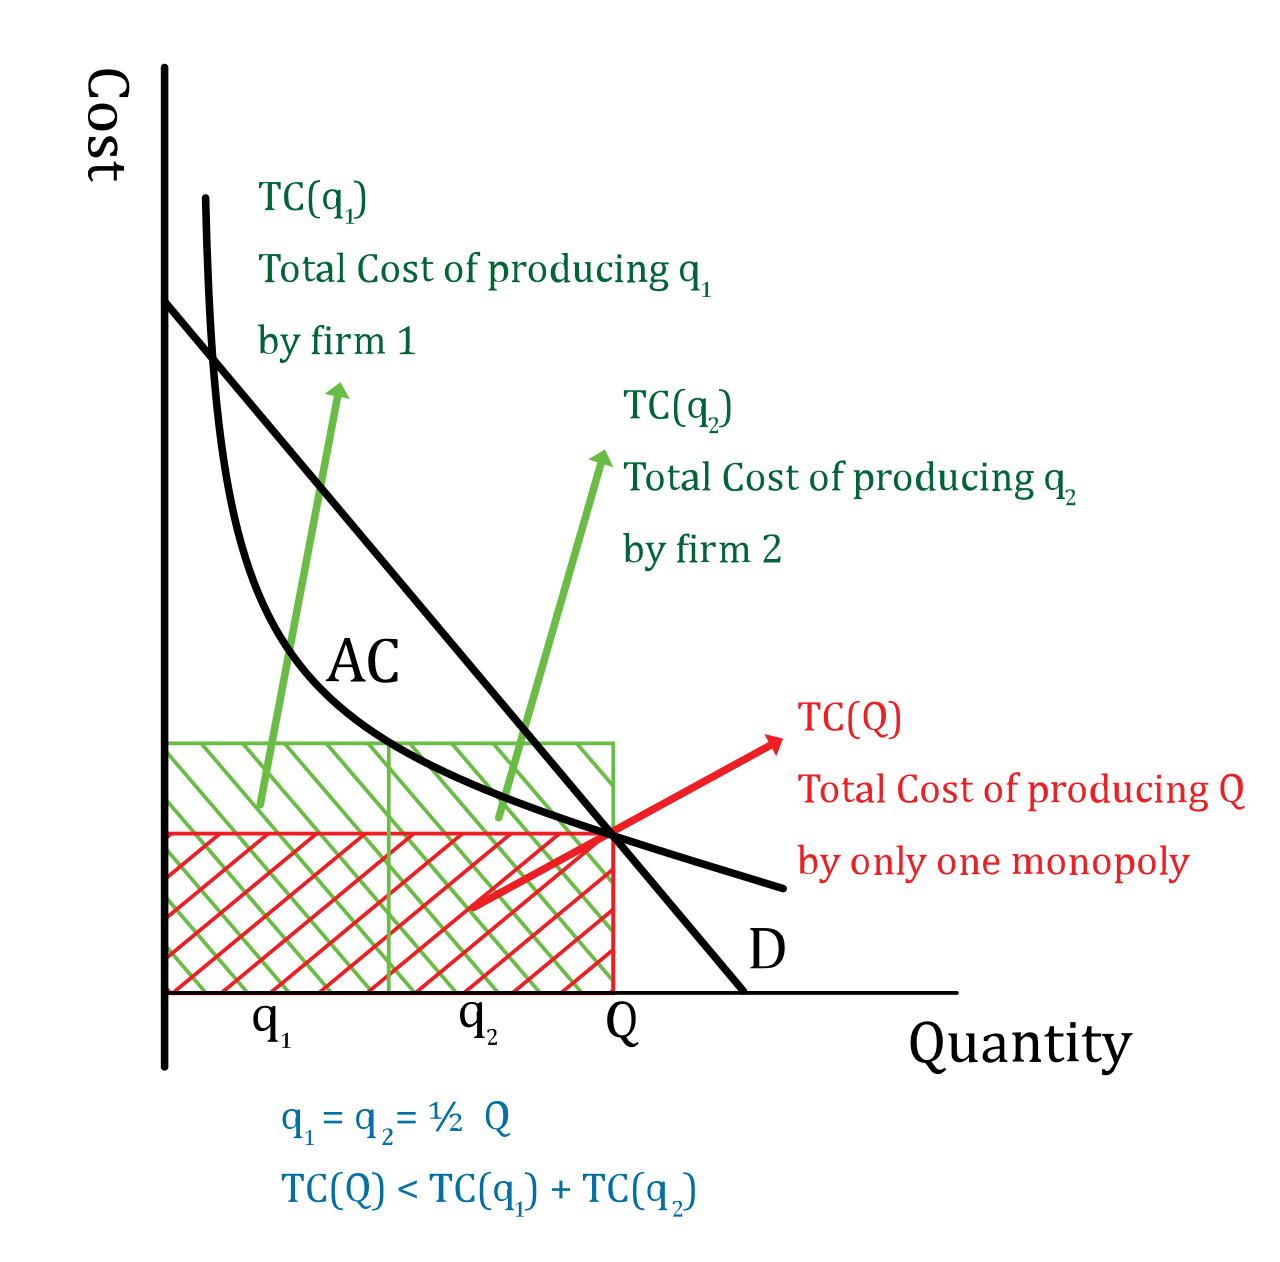
This diagram illustrates a natural monopoly, where one large firm can produce at lower average cost than multiple firms. It is useful when explaining why some industries tend toward a single dominant producer. Source
Oligopoly
· Oligopoly = market dominated by a few large firms.
· The key feature is interdependence: each firm must consider rivals’ likely reactions.
· Oligopolies may be collusive or non-collusive.
· Collusive oligopoly acts more like a monopoly.
· Firms face the risk of price war if they compete aggressively on price.
· There is an incentive to collude to increase joint profits.
· There is also an incentive to cheat on collusive agreements to gain individual market share/profit.
· Oligopoly can create allocative inefficiency and therefore market failure.
· Competition may be price competition or non-price competition.
· Concentration ratios are used to measure market concentration
Monopolistic competition
· Monopolistic competition has many firms and free entry, but products are differentiated.
· Firms have some market power, but less than a monopoly because there are many substitutes.
· Therefore, the demand curve is more elastic than for a monopoly.
· Firms still choose output where .
· In the short run, firms may make abnormal profit, normal profit, or losses.
· In the long run, free entry tends to reduce profit toward normal profit.
· It is still allocatively inefficient, but usually less inefficient than monopoly.
· Main benefit: greater product variety.
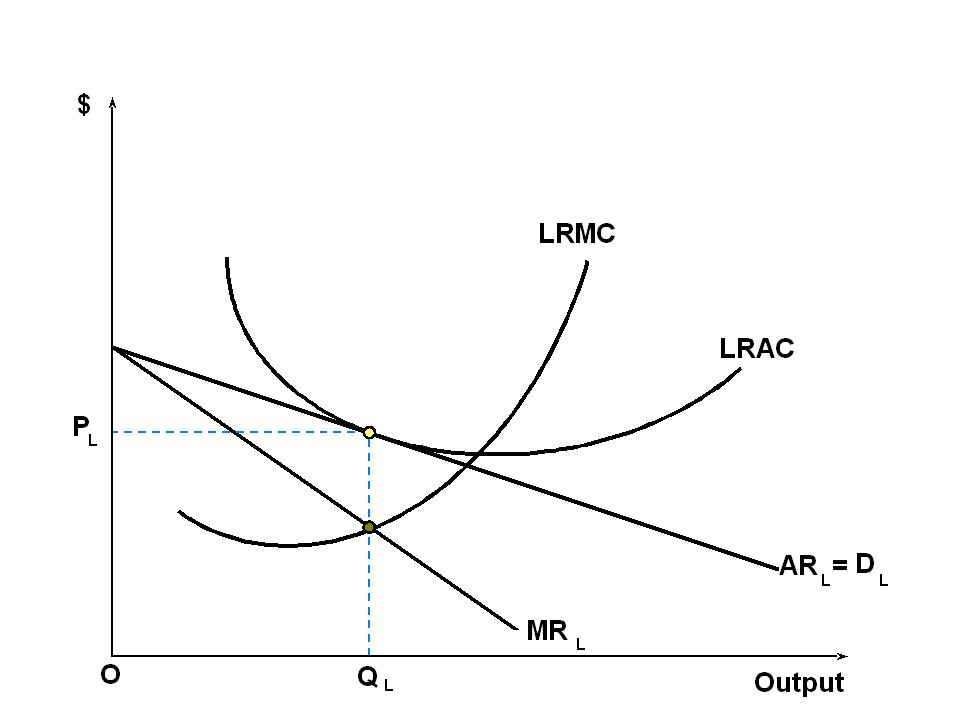
This diagram shows a firm in long-run equilibrium under monopolistic competition, where only normal profit is earned after entry of rivals. It also helps show why the market still does not achieve full allocative efficiency. Source
Advantages of large firms with significant market power
· Economies of scale may lower costs.
· This is especially relevant for natural monopolies.
· Abnormal profits may finance research and development (R&D).
· This can support innovation.
· In evaluation, market power is not always purely harmful; some benefits may exist alongside inefficiency.
Risks of markets dominated by one or a few very large firms
· Risk of lower output.
· Risk of higher price.
· Risk of reduced consumer choice.
· These risks are central to explaining why market power can be treated as a form of market failure.
Government intervention in response to abuse of market power
· Legislation and regulation can limit abuse of market power.
· Government ownership may be used in some industries.
· Fines may be imposed for anti-competitive behaviour.
· In evaluation, always consider likely effects on efficiency, consumers, firms, and choice.
Exam diagrams and calculations you must know
· Perfectly competitive firm as price taker with .
· Perfect competition showing abnormal profit, normal profit, and losses.
· Perfect competition and allocative efficiency where or .
· Monopoly showing profit maximization and abnormal profit / normal profit / losses.
· Monopoly vs perfect competition showing higher price, lower output, and welfare loss under monopoly.
· Natural monopoly diagram.
· Collusive oligopoly acting as a monopoly.
· Simple game theory payoff matrix.
· Monopolistic competition showing abnormal profit / normal profit / losses.
· Monopolistic competition with a more elastic demand curve than monopoly.
Checklist: can you do this?
· Define market power, perfect competition, monopoly, oligopoly, and monopolistic competition accurately.
· Explain why gives the profit-maximizing output, and distinguish abnormal profit, normal profit, and losses using and .
· Draw and interpret the required diagrams, especially perfect competition, monopoly, natural monopoly, collusive oligopoly, and monopolistic competition.
· Compare monopoly with perfect competition in terms of price, output, allocative efficiency, and welfare loss.
· Evaluate both the advantages of large firms and the need for government intervention against abuse of market power.