Standing waves: core ideas
A standing wave forms by superposition of two identical waves with the same frequency, wavelength and amplitude travelling in opposite directions.
Unlike a travelling wave, the pattern is stationary: fixed positions of zero amplitude and maximum amplitude appear.
Nodes are points of zero displacement at all times.
Antinodes are points of maximum displacement/amplitude.
The amplitude varies with position: 0 at nodes and maximum at antinodes.
All points between the same pair of adjacent nodes oscillate in phase.
Points on opposite sides of a node oscillate in antiphase.
Adjacent nodes are separated by .
Adjacent antinodes are separated by .
The distance from a node to the nearest antinode is .
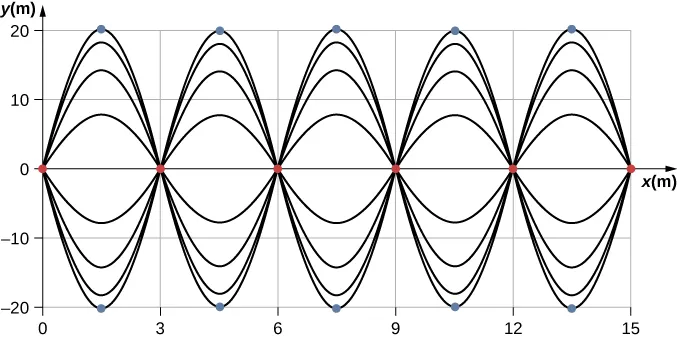
This diagram shows a standing wave produced by two identical waves travelling in opposite directions. It clearly labels nodes and antinodes, making it ideal for identifying where displacement is always zero or maximum. Use it to visualize why the pattern stays fixed in space. Source
Standing waves on strings
For a string, the allowed patterns depend on the boundary conditions at the ends.
Fixed end node at the boundary.
Free end antinode at the boundary.
For a string with two fixed ends or two free ends: .
Therefore for these cases: and .
The first harmonic is the lowest-frequency mode.
Higher harmonics have more nodes and antinodes and higher frequency.
For a string with one fixed end and one free end: .
In the fixed-free case, only odd harmonics occur:
For fixed-free: and .
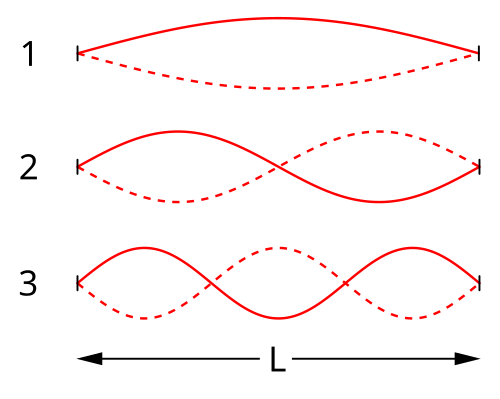
This image shows the first three modes of a string of length . It is useful for spotting how the number of nodes, antinodes, and loop sections changes from one harmonic to the next. Compare each mode with the formula . Source
Standing waves in pipes (air columns)
In pipes, standing waves are discussed using displacement nodes and displacement antinodes.
Open end of a pipe displacement antinode.
Closed end of a pipe displacement node.
Pressure nodes and antinodes are not required for this topic.
For a pipe with two open ends or two closed ends: .
Therefore: and .
For a pipe with one open end and one closed end: .
In an open-closed pipe, only odd harmonics occur.
Therefore for open-closed: and .
Always use after finding the allowed wavelength.
The syllabus uses first harmonic for the lowest-frequency mode; do not use fundamental or overtone in IB exam answers.
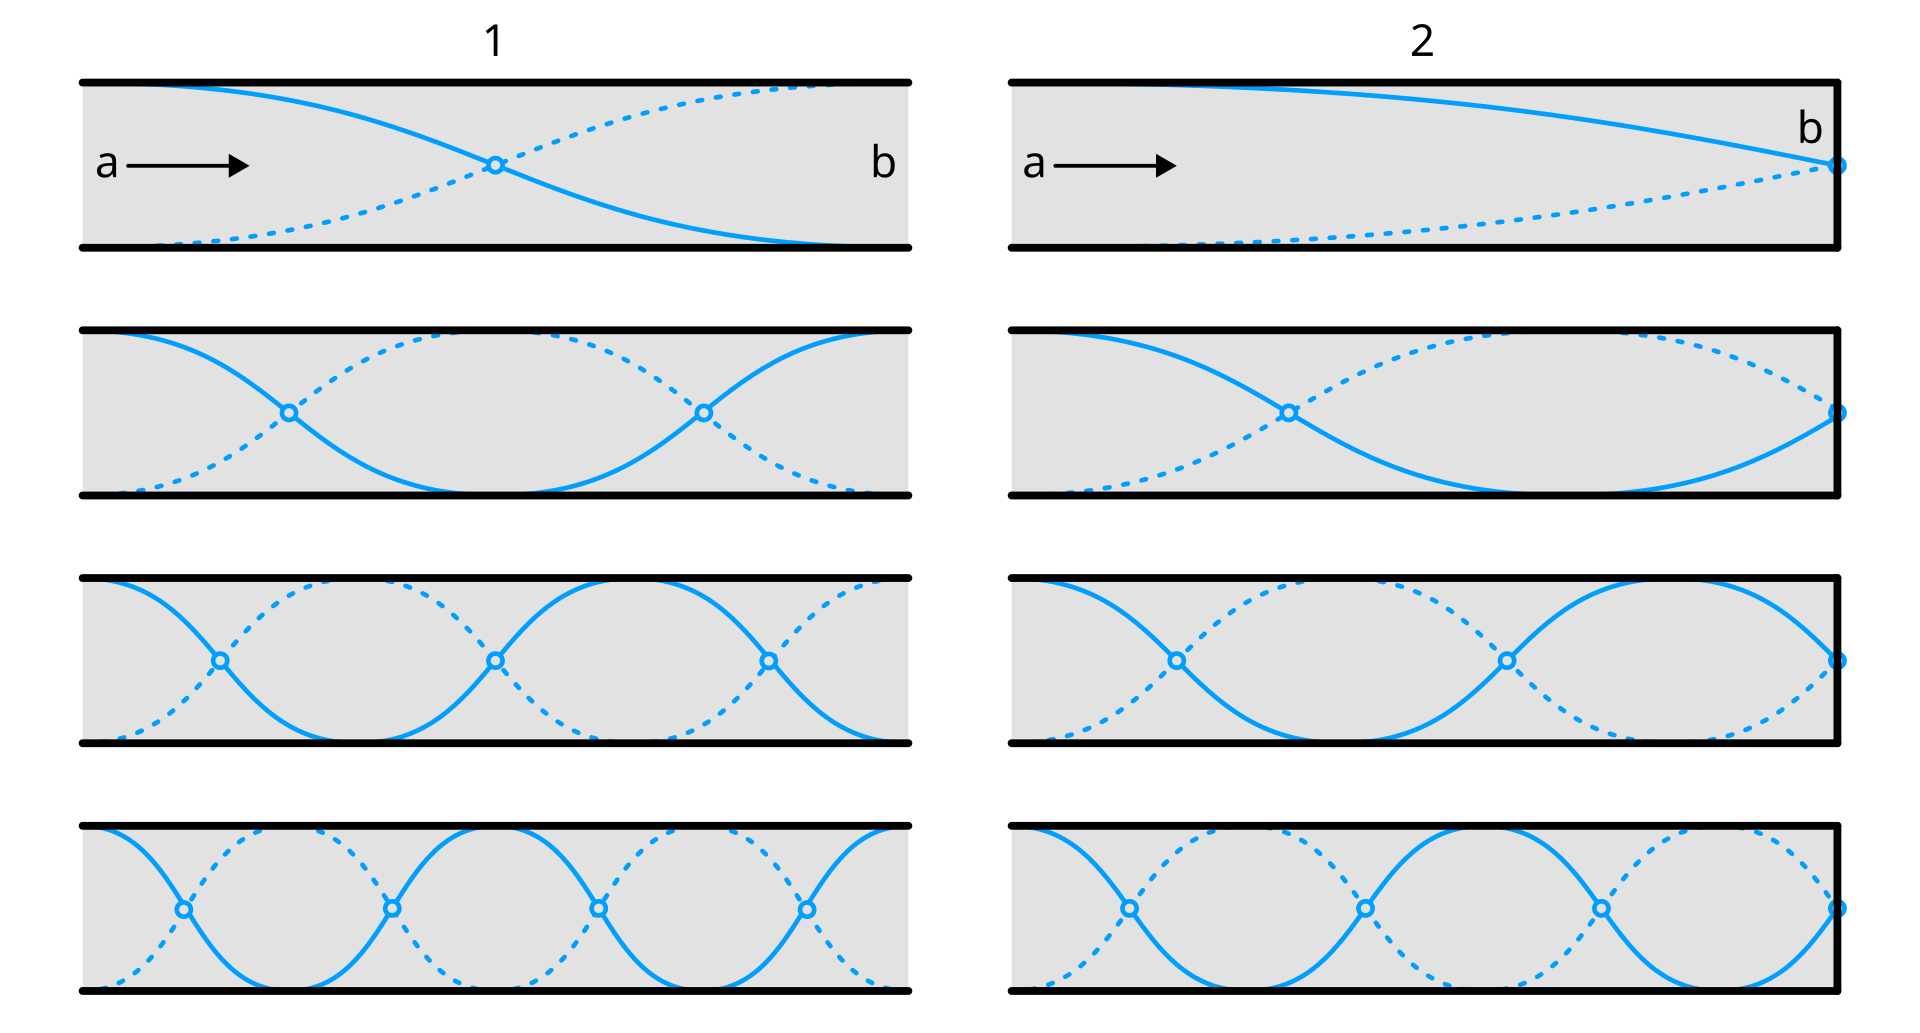
This diagram compares standing-wave patterns in open-open and open-closed air columns. It helps you match each pipe end to a displacement node or displacement antinode and see why odd harmonics only occur in the open-closed case. Use it when deriving allowed wavelengths from the pipe length . Source
Resonance
Resonance happens when a driving frequency matches a system’s natural frequency.
At resonance, the system oscillates with maximum amplitude.
The amplitude becomes large because energy is transferred to the oscillator most efficiently.
A standing wave pattern appears only at the system’s allowed resonant frequencies.
In strings and pipes, these allowed frequencies are the harmonic frequencies.
Useful effects of resonance include musical instruments and selecting a desired frequency.
Destructive effects of resonance include excessive vibration in bridges, buildings, and machinery.
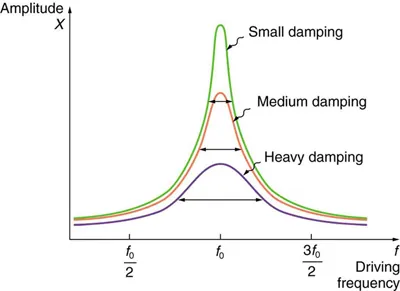
This graph shows how oscillation amplitude changes with driving frequency for different amounts of damping. The peak occurs near the natural frequency, illustrating resonance. It is especially helpful for linking damping to both peak amplitude and the width of the resonance curve. Source
Damping and frequency response
Damping removes energy from an oscillating system.
Increasing damping reduces the maximum amplitude at resonance.
Increasing damping makes the resonance peak less sharp and broader.
Increasing damping also changes the resonant frequency of oscillation; this is treated qualitatively.
Light damping: oscillations continue but with amplitude that gradually decreases.
Critical damping: the system returns to equilibrium in the shortest time without oscillating.
Heavy damping: the system returns to equilibrium without oscillating, but more slowly than critical damping.
Exam tip: distinguish light damping from heavy damping by whether oscillations still occur.
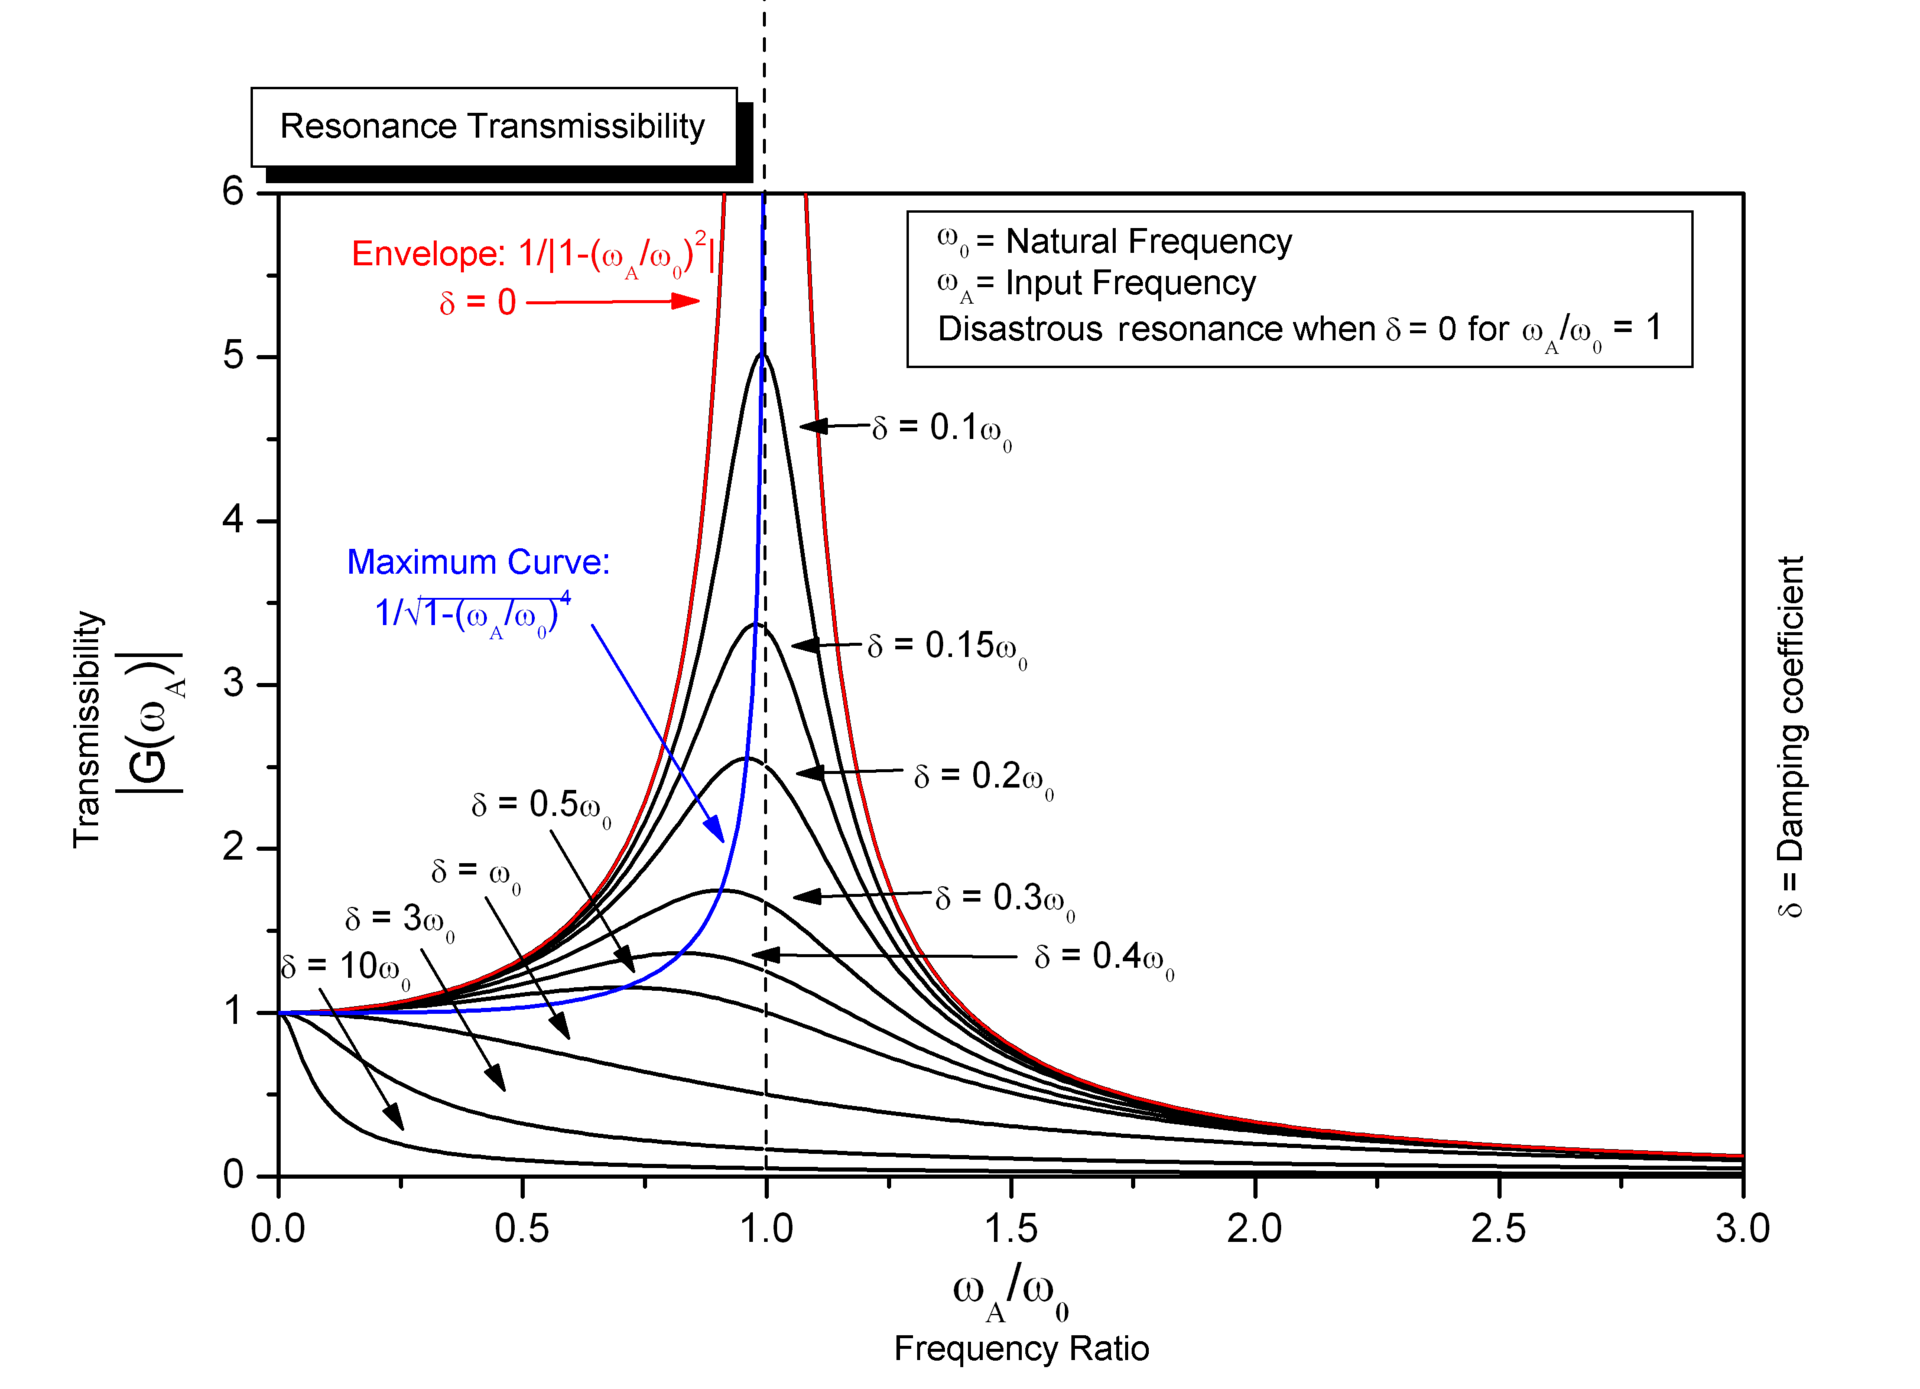
This graph compares resonance curves for different damping coefficients. Lower damping gives a taller, sharper peak, while heavier damping gives a lower, broader response. It is useful for explaining why damping reduces the amplitude at resonance. Source
Exam method: harmonics in strings and pipes
First identify the boundary conditions at each end.
Mark each end as a node or antinode.
Decide whether the pattern uses half-wavelength sections or quarter-wavelength sections.
Write the length condition: either or .
Rearrange to find the allowed wavelength.
Then use .
Check whether all harmonics are allowed or odd harmonics only.
State the mode clearly as the first harmonic, second harmonic, third harmonic, and so on.
Checklist: can you do this?
Identify nodes, antinodes, phase relationships, and relative amplitude on a standing-wave diagram.
Determine the allowed wavelengths and frequencies for strings and pipes from the boundary conditions.
Recognize when only odd harmonics are possible.
Explain resonance using natural frequency, driving frequency, and energy transfer.
Describe the effect of light, critical, and heavy damping on oscillation and resonance.