
AP Syllabus focus:
‘Understanding how the confidence level affects the width of a confidence interval: increasing the confidence level results in a wider interval. This is due to the increased certainty required to capture the population proportion, which necessitates a broader range of values.’
Confidence level influences how wide a confidence interval must be to reflect our desired certainty. Higher confidence demands broader intervals to ensure the true population proportion is captured.
Confidence Level and Interval Width
The confidence level is the long-run proportion of confidence intervals that would capture the true population proportion if we repeatedly sampled using the same method. Its effect on interval width is essential for understanding the trade-off between precision and certainty. Because a higher confidence level requires stronger assurance that the interval contains the true parameter, the resulting confidence interval widens to accommodate this increased certainty.
A confidence level is typically expressed as a percentage, such as 90%, 95%, or 99%, representing the expected success rate of intervals over many repetitions. Increasing this percentage signals that we want the interval to be more reliable, and therefore the interval must expand to include more plausible values consistent with the sampling variability of the statistic.
Why Confidence Level Influences Width
The connection between confidence level and interval width arises from the role of the critical value, the multiplier that determines how far the interval extends from the point estimate. Higher confidence levels correspond to larger critical values from the standard normal distribution. When the critical value increases, the margin around the sample proportion necessarily expands.
Critical Value: A multiplier taken from the standard normal distribution that reflects the confidence level and determines the distance from a sample estimate to the interval boundary.
A critical value ensures the chosen percentage of the distribution is captured between the endpoints. Because a higher confidence level captures more of the distribution, the endpoints must move farther from the center, widening the interval around the sample proportion. This widening reflects additional uncertainty tolerated in exchange for greater certainty of including the true parameter.
Relationship to Margin of Error
The margin of error, which determines half the width of a confidence interval, directly incorporates the critical value. Thus, any change in confidence level affects the margin of error and consequently changes the full interval width. A higher margin of error indicates less precision, while a lower one indicates more precision but reduced certainty.
EQUATION
= Critical value determined by the confidence level
= Sample proportion
= Sample size
Larger critical values increase the overall margin, causing the confidence interval to widen proportionally. Because the width of a confidence interval is the margin of error, any change in directly changes the interval width.
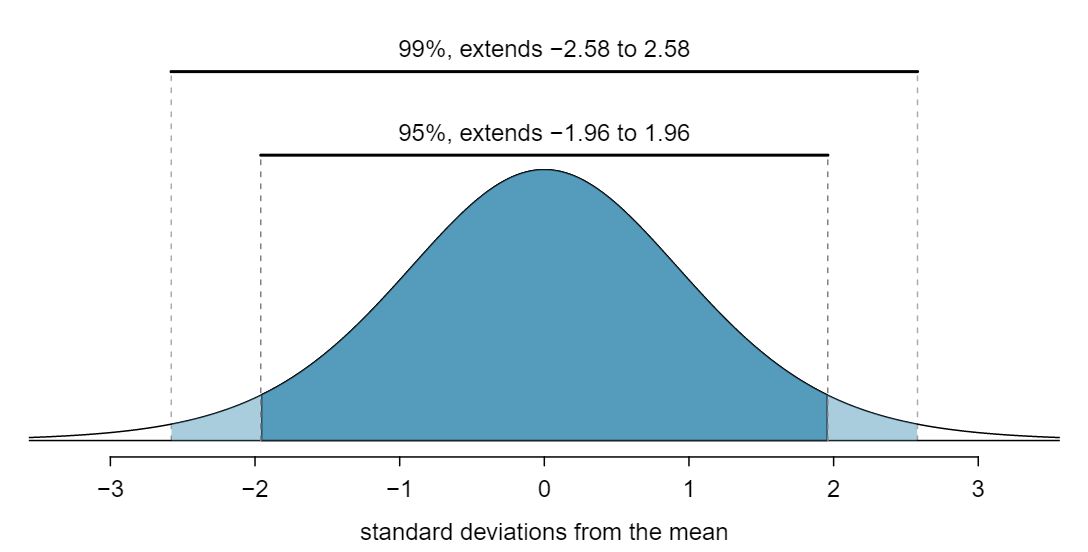
This figure compares intervals capturing 95% and 99% of the normal distribution. Because the 99% interval reaches further into the tails, it becomes wider, demonstrating why greater confidence requires accepting a wider interval estimate. Source.
A normal sentence is included here to maintain proper spacing requirements before the next definition or equation block.
Visualizing the Effect Conceptually
To conceptualize the relationship, imagine the sampling distribution of the sample proportion as a normal curve centered at the true population proportion. A narrow interval captures only a smaller central portion of the curve, corresponding to a lower confidence level. A wider interval expands outward to include more of the curve, representing a higher confidence level. The endpoints shift farther into the distribution’s tails as confidence increases, signaling higher tolerance for uncertainty in the estimate but stronger assurance of capturing the actual parameter.
Practical Implications for Statistical Inference
Understanding how confidence level affects interval width is crucial for designing studies and interpreting results responsibly. Key considerations include:
Higher confidence → wider interval: This trade-off ensures increased certainty of containing the population parameter.
Lower confidence → narrower interval: Precision increases, but the chance of missing the true parameter also increases.
Critical value determines expansion: Values such as 1.645, 1.96, and 2.576 correspond to commonly used confidence levels and directly control width.
Sample size remains constant: When sample size does not change, only the confidence level affects the critical value and thus the interval width.
Higher confidence levels correspond to intervals that cover a larger portion of the normal distribution, so the intervals themselves are longer.
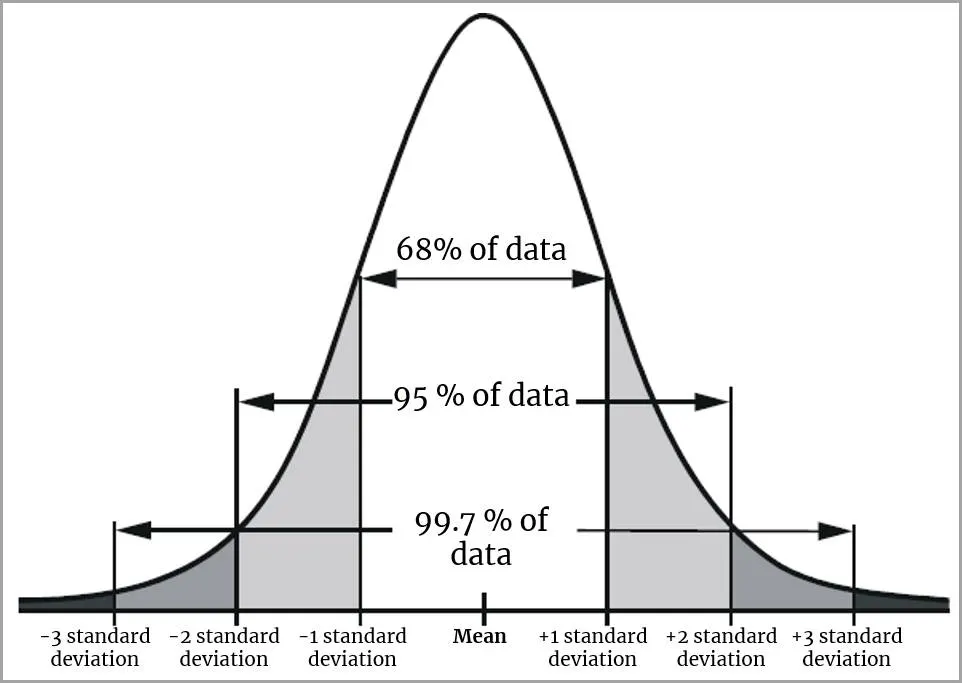
This diagram shows how increasing the confidence level expands the interval needed to capture a larger portion of the normal distribution. Each bar widens as the confidence level rises, visually reinforcing the inverse relationship between confidence and precision. The inclusion of the 68–95–99.7 empirical-rule percentages adds helpful context beyond the syllabus requirement but does not change the core concept illustrated. Source.
In applied work, researchers must balance precision and confidence depending on the study’s goals. For exploratory research, narrower intervals may be acceptable, while high-stakes decisions often require higher confidence levels despite wider intervals.
Interpreting Width in Context
When communicating confidence intervals, it is essential to reference the interval width relative to the confidence level. A wider interval should be understood not as weaker evidence but as an intentional choice for stronger assurance. Conversely, a narrow interval reflects higher precision but carries more risk of missing the true population proportion.
Because confidence intervals frame statistical reasoning within uncertainty, awareness of the impact of confidence level helps ensure that interpretations reflect an appropriate level of caution and clarity rooted in the statistical design.
FAQ
Higher confidence levels are typically used when the consequences of being wrong are more serious, such as in medical or safety-related contexts.
However, wider intervals may reduce the usefulness of the estimate because they provide a less precise range.
In contrast, lower confidence levels offer narrower intervals but increase the risk of missing the true proportion.
The tails of the normal distribution get thinner as you move further from the centre, so capturing additional probability mass requires a disproportionately large horizontal expansion.
This means the jump from 95% to 99% is bigger than from 90% to 95%, even though both represent a 5% increase in confidence.
A larger sample size reduces the standard error, which narrows the interval.
However, there is a limit: even very large samples cannot completely eliminate the widening effect of a substantially higher confidence level.
They can only reduce, not reverse, the interval expansion that comes from requiring more certainty.
Comparisons are possible, but caution is needed.
Intervals with different confidence levels do not represent uncertainty in the same way, so one interval being wider does not necessarily imply greater variability in the sample.
A fair comparison usually requires recalculating both intervals at the same confidence level before drawing conclusions.
Very high confidence levels produce intervals so wide that they become impractical for decision-making.
They may obscure meaningful differences or trends because the interval covers too large a range.
Researchers typically balance the desire for high certainty with the need for a usable, interpretable interval.
Practice Questions
Question 1 (1–3 marks)
A researcher constructs two confidence intervals for the same population proportion using the same sample data. Interval A is a 90% confidence interval, and Interval B is a 99% confidence interval.
(a) Which interval will be wider?
(b) Briefly explain why.
Question 1
(a)
• Interval B (99% confidence interval) is wider. (1 mark)
(b)
• Explanation stating that a higher confidence level requires a larger critical value or more of the sampling distribution, thus making the interval wider. (1–2 marks)
Full marks require both identification and correct reasoning.
Question 2
A school conducts a survey to estimate the proportion of students who prefer online assessments. Using a sample of students, the school constructs a 95% confidence interval for the population proportion.
(a) If the school instead constructs a 99% confidence interval using the same sample, describe how the width of the interval will change and explain why.
(b) Suppose the school wants a narrower confidence interval but does not wish to reduce the confidence level. State one adjustment they could make and explain why it would narrow the interval.
Question 2 Mark Scheme (4–6 marks)
(a)
• Correct statement that the 99% confidence interval will be wider than the 95% interval. (1 mark)
• Explanation that a higher confidence level requires a larger critical value or more coverage of the sampling distribution. (1–2 marks)
(b)
• States an appropriate adjustment (e.g., increase sample size). (1 mark)
• Explains that increasing sample size reduces the standard error, which narrows the confidence interval while keeping the confidence level the same. (1–2 marks)
Award 4–6 marks depending on completeness, clarity, and accuracy across both parts.
