
AP Syllabus focus:
‘Discuss the role of expected counts in the chi-square test for independence, highlighting how they serve as a basis for comparison against observed counts. Emphasize that significant deviations between observed and expected counts can indicate a relationship between the variables in the table.’
Expected counts allow statisticians to compare what is observed in a two-way table with what would be anticipated if variables were truly independent, supporting meaningful chi-square inference.
Understanding Expected Counts in Two-Way Tables
Expected counts form the foundation of the chi-square test for independence, providing a structured way to evaluate whether two categorical variables are associated. When analyzing categorical data arranged in a two-way table, statisticians rely on expected counts to establish a baseline scenario: what the distribution of counts would look like if the variables had no relationship.
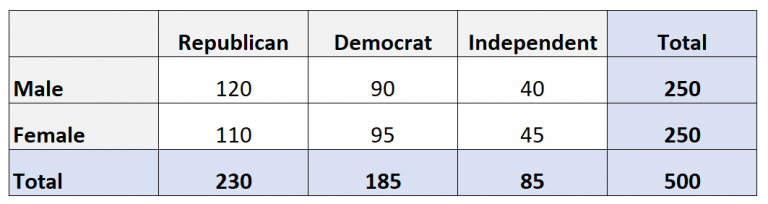
Two two-way tables display observed and expected counts under an assumption of independence, illustrating how expected counts provide a baseline against which real data are compared. Source.
This makes expected counts a crucial comparison point, helping differentiate ordinary sampling variation from meaningful departures that suggest an association.
The Purpose of Expected Counts
Expected counts represent the frequencies that would arise purely by chance under the null hypothesis of independence, which states that the row and column variables do not affect each other. Because statistical inference requires a reference model, expected counts supply that model by quantifying an anticipated pattern of distribution.
Why Expected Counts Matter
Expected counts serve several essential purposes:
They anchor the chi-square calculation by providing comparison values to evaluate discrepancies between observed and expected data.
They reflect the proportions implied by independence, ensuring that each expected value aligns with the marginal totals of the table.
They help determine whether deviations are small and due to chance or large and potentially meaningful.
They create a consistent structure for measuring how well the data fit the independence assumption.
Relationship to the Chi-Square Test for Independence
The chi-square test examines whether observed frequencies differ from expected frequencies to a degree unlikely to occur under independence. This comparison is central to evaluating potential associations between variables.
Expected Counts as the Basis for Comparison
Because expected counts describe what would occur if no relationship existed, they function as the benchmark against which the strength of deviation is assessed. Larger deviations, especially when consistent across multiple cells, increase evidence that the variables are connected.
Using Expected Counts in the Chi-Square Statistic
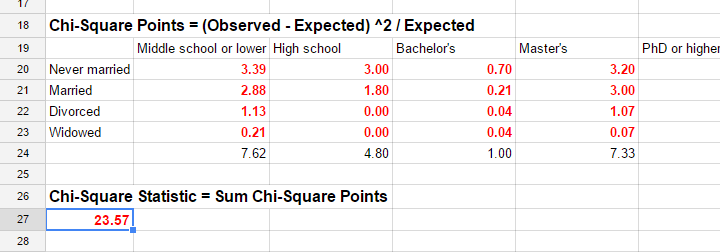
The chi-square statistic aggregates the discrepancies between observed and expected counts across all table cells. Each deviation contributes proportionally to the statistic, helping quantify how incompatible the observed data are with independence.
EQUATION
= Total count for row i
= Total count for column j
= Total number of observations in the table
This formula ensures that expected counts preserve the overall distribution of totals while modeling what would occur under independence.
A table of expected frequencies shows how counts would distribute under perfect independence, with margins preserved. The real-world categories provide context but do not extend beyond the concepts required by the AP syllabus. Source.
A sentence helps transition: Expected counts produced by this formula allow statisticians to evaluate not only individual discrepancies but also overall patterns of deviation.
Interpreting Deviations from Expected Counts
Substantial deviations between observed and expected values suggest that independence may not hold. Small deviations typically indicate no meaningful association, reflecting ordinary random variability.
Indicators of Potential Association
When examining a table:
Large positive deviations (observed > expected) indicate cells where joint occurrence is more frequent than independence predicts.
Large negative deviations (observed < expected) indicate joint occurrences that are less frequent than expected.
Consistent patterns of deviation across related cells strengthen evidence of association, not just random fluctuation.
How Expected Counts Support Statistical Inference
Expected counts enhance inference by:
Providing a neutral, mathematically derived baseline.
Allowing deviations to be quantified in a standardized manner.
Enabling the chi-square test to summarize evidence efficiently.
Helping determine whether differences arise from sampling or from a true underlying relationship.
Expected counts thus play a vital role in distinguishing chance behavior from systematic association between categorical variables.
Ensuring Expected Counts Suitability for the Chi-Square Test
Expected counts must satisfy certain conditions to ensure the chi-square procedure is accurate. When expected values become too small, the approximation to the chi-square distribution weakens.
Condition Related to Expected Counts
All expected counts should be greater than 5, ensuring the chi-square model reliably approximates the true sampling distribution.
Meeting this condition helps reduce distortions that occur when categories contain sparse data.
A brief sentence connects this to practice: By ensuring expected counts meet this requirement, the chi-square test remains robust and trustworthy for evaluating independence.
The Broader Importance of Expected Counts
Expected counts not only offer a mechanism for conducting hypothesis tests but also foster conceptual understanding of independence. They allow students to visualize how two variables would interact under no association and to appreciate how observed patterns diverge meaningfully from that baseline. Through this role, expected counts support critical reasoning about relationships in categorical data and reinforce the foundation for interpreting chi-square test outcomes.
FAQ
Expected counts must respect the marginal totals because these totals are fixed characteristics of the sample. They represent the overall distribution of each variable and ensure that the expected table is mathematically consistent with the observed data.
This alignment preserves the proportional structure implied by independence, allowing deviations to reflect genuine differences in joint behaviour rather than inconsistencies in total counts.
Expected counts provide a benchmark describing what randomness alone would produce. If observed counts show only small irregularities around this baseline, the pattern is plausibly due to chance.
However, if several cells differ systematically or substantially from their expected values, this suggests the presence of a meaningful association between the variables.
Yes. The choice of categories affects marginal totals and the distribution of counts across cells.
Wide or unevenly sized categories can lead to very small expected counts in some cells. In such cases:
The chi-square test becomes less reliable.
Reconsidering category boundaries or combining sparse categories may improve expected count adequacy.
Expected counts depend on the product of their row and column totals. Cells belonging to large row and column groups will naturally have higher expected values.
This means variations in marginal distributions influence where the most substantial expected frequencies occur, shaping how much each cell contributes to the chi-square statistic.
Yes. Examining expected counts alongside observed counts can highlight early signs of association.
For example:
Cells where observed values are consistently above or below expected values may suggest directional patterns.
Symmetry or imbalance across categories can become apparent before formal calculations, guiding deeper investigation.
Practice Questions
Question 1 (1–3 marks)
A researcher constructs a two-way table comparing students’ year group (Year 10 or Year 11) with whether they prefer revision videos or revision notes. Explain the purpose of calculating the expected counts for each cell of the table when carrying out a chi-square test for independence.
Question 1
1 mark: States that expected counts provide the frequencies that would occur if the two variables were independent.
1 mark: Mentions that they form the baseline or reference for comparison with observed counts.
1 mark: Notes that comparing observed and expected counts allows identification of whether any differences are larger than would be expected by chance.
Question 2 (4–6 marks)
A school investigates whether participation in an after-school maths club is associated with students’ confidence levels (Low, Medium, High). The observed two-way table is shown below:
Maths club: Yes — 12 Low, 25 Medium, 18 High
Maths club: No — 20 Low, 22 Medium, 10 High
(a) State what the expected counts represent under the null hypothesis of independence.
(b) Explain how comparing observed and expected counts helps determine whether club participation and confidence level are associated.
(c) Describe what large deviations between observed and expected counts would indicate in the context of this study.
Question 2
(a) (1–2 marks)
1 mark: Expected counts describe what the distribution across confidence levels would look like if maths club attendance and confidence were independent.
1 mark: Expected counts preserve the marginal totals while modelling the assumption of no association.
(b) (1–2 marks)
1 mark: Observed counts are compared with expected counts to assess how far the data deviate from independence.
1 mark: Explains that small discrepancies suggest independence, whereas larger discrepancies may indicate an association.
(c) (2 marks)
1 mark: Large deviations imply that the observed distribution differs substantially from what would be anticipated under independence.
1 mark: In context, this would suggest that maths club participation may be related to students’ confidence levels.
