
AP Syllabus focus:
‘Learning Objective: Determine the p-value for a chi-square significance test for independence or homogeneity. Essential Knowledge: The p-value for a chi-square test is found using the chi-square distribution table or technology, based on the calculated degrees of freedom. It reflects the probability of observing a chi-square statistic as extreme as, or more extreme than, the one calculated from the data, assuming the null hypothesis is true.’
Determining the p-value in a chi-square test is essential because it quantifies how strongly the observed data contradict the null hypothesis, guiding statistical decision-making.
Determining the p-value in Chi-Square Tests
The process of determining a p-value for chi-square significance tests—whether for homogeneity or independence—relies on comparing the computed chi-square statistic to the theoretical chi-square distribution associated with the correct degrees of freedom. Because chi-square tests evaluate how far observed counts diverge from expected counts under the null hypothesis, interpreting the p-value helps assess whether such discrepancies are believable as random variation.
Understanding the Role of the Chi-Square Distribution
The chi-square distribution is a family of right-skewed probability distributions used for hypothesis testing based on categorical data. Each distribution in this family is defined by a specific number of degrees of freedom, reflecting the structure of the table used in the test. The p-value is determined by locating where the test statistic falls within this distribution.
p-value: The probability, assuming the null hypothesis is true, of obtaining a test statistic as extreme as or more extreme than the observed statistic.
The chi-square distribution is especially suited for categorical data because the chi-square statistic measures accumulated squared deviations between observed and expected counts, ensuring all contributions are nonnegative. As the degrees of freedom increase, the distribution becomes less skewed, affecting how p-values are interpreted across different table sizes.
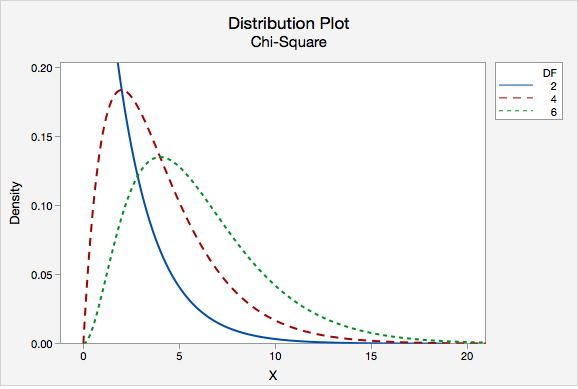
This figure illustrates how chi-square distributions change shape as degrees of freedom increase, becoming less skewed and more spread out, which directly affects p-value interpretation. Source.
Connecting the Test Statistic to the p-value
The p-value is directly tied to the chi-square statistic calculated earlier in the procedure. Larger chi-square values indicate greater discrepancies between observed and expected counts. Understanding this relationship is fundamental to interpreting the output of chi-square tests for homogeneity or independence.
EQUATION
= Chi-square statistic, a measure of discrepancy
= Observed count in each cell
= Expected count in each cell
After computing the chi-square statistic, determining the p-value requires identifying the probability of observing a statistic this large or larger if the null hypothesis is true. Because this relies on tail probabilities, technology or chi-square tables must be used to find the appropriate value.
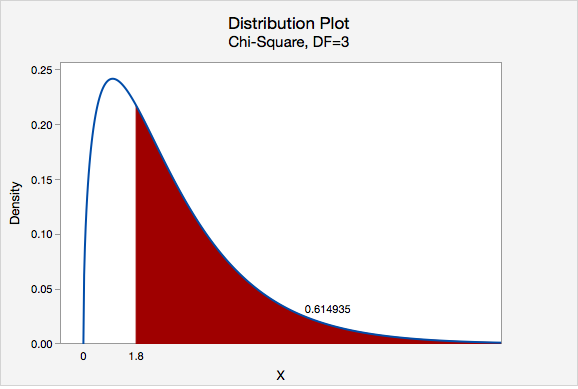
The shaded right-tail area shows the p-value corresponding to a specific chi-square statistic, highlighting that the p-value represents the probability of obtaining a value this extreme or more extreme under the null hypothesis. Source.
Using Degrees of Freedom to Find the p-value
The number of degrees of freedom (df) determines which chi-square distribution is appropriate for evaluating the statistic. For chi-square tests of homogeneity or independence, the degrees of freedom depend on the number of rows and columns in the two-way table.
EQUATION
= Number of rows
= Number of columns
A single sentence here bridges the definition and application: knowing the correct degrees of freedom ensures that the p-value is calculated from the correct distribution.
Methods for Determining the p-value
Students may determine the p-value using one of two primary approaches. Both align with the AP Statistics expectation that technology is acceptable and often preferred.
Using chi-square distribution tables:
These tables provide the right-tail probabilities for various chi-square statistics across degrees of freedom.
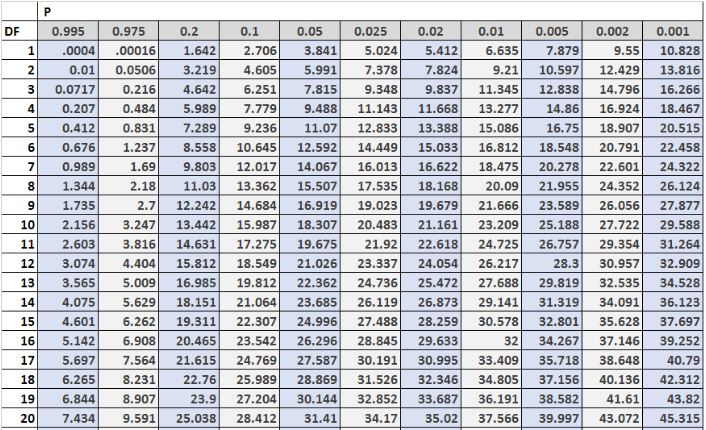
This table lists critical values for a range of degrees of freedom and significance levels. Students compare their test statistic to these cutoff values to approximate p-values. The table includes more alpha levels than required, but the additional information does not interfere with understanding the core concept. Source.
Because the chi-square test is always one-sided, only upper-tail probabilities are used.
• Locate the row for the correct degrees of freedom.
• Identify the range within which the computed chi-square statistic falls.
• Match that range to the corresponding right-tail probability interval.
Using statistical technology:
Technology such as graphing calculators, statistical software, or online tools computes exact p-values, eliminating the need to identify ranges as in a table.
• Input the chi-square statistic and degrees of freedom.
• Use a chi-square cumulative distribution function to compute the upper-tail probability.
• Interpret the output as the p-value.
A normal sentence is placed here to maintain proper spacing before introducing further structured content.
Interpreting the Meaning of the p-value
Once determined, the p-value plays a central role in statistical inference. Because the chi-square test evaluates whether discrepancies between observed and expected counts could plausibly occur by chance, the p-value provides a quantitative basis for evaluating this plausibility.
A small p-value indicates that the observed discrepancies would be unlikely if the null hypothesis were true, suggesting evidence against independence (in tests of independence) or against equal distributions (in tests of homogeneity). Conversely, a large p-value indicates that the discrepancies are consistent with expected random variation under the null hypothesis.
Bullet points help clarify the logic underlying interpretation:
• The p-value reflects upper-tail probability only, since large chi-square values reflect stronger evidence against the null hypothesis.
• Smaller p-values correspond to chi-square statistics farther into the right tail.
• The significance of the p-value depends on a chosen α-level, typically 0.05 in AP Statistics contexts.
• The p-value does not measure the probability that the null hypothesis is true; rather, it measures how surprising the data would be if the null hypothesis were true.
A final sentence reinforces the purpose of the subsubtopic: determining the p-value is a crucial step that links the chi-square test statistic to an evidence-based inferential decision.
FAQ
The distribution is highly skewed for low degrees of freedom, meaning small changes in the chi-square statistic can result in large changes in the p-value.
With higher degrees of freedom, the distribution becomes more spread out and less skewed. This leads to smoother changes in tail probability, making p-values more stable and precise when using tables or technology.
The chi-square statistic measures the size of deviations between observed and expected counts. Larger values correspond to greater disagreement with the null hypothesis.
Because only unusually large deviations signal evidence against the null hypothesis, the probability of obtaining values as large or larger than the observed statistic is always found in the upper tail.
Chi-square tables typically list only selected critical values for common significance levels, creating broad intervals rather than exact probabilities.
This means you can often only identify a range in which the p-value lies. Technology is used for exact p-values because it evaluates the cumulative probability directly for any chi-square value.
Rounding can shift the statistic across a table boundary or alter the value entered into technology.
This may slightly change the p-value, especially when the statistic is near a cut-off.
To minimise this effect:
• round only at the final calculation step
• report p-values to at least three decimal places when possible
Yes. A smaller chi-square statistic with low degrees of freedom can have the same p-value as a larger statistic with high degrees of freedom.
This happens because the distribution shifts shape with degrees of freedom.
What remains constant is the meaning of the p-value: the probability of obtaining a statistic at least as extreme under the null hypothesis.
Practice Questions
Question 1 (1–3 marks)
A chi-square test for independence produced a test statistic of 7.9 with 4 degrees of freedom. Using the chi-square distribution, explain what the p-value represents in this context and state whether a p-value would be found in the upper or lower tail of the distribution.
Question 1
• Correctly states that the p-value represents the probability of obtaining a chi-square statistic as extreme as or more extreme than 7.9, assuming the null hypothesis is true. (1 mark)
• States that the p-value corresponds to the upper tail of the chi-square distribution. (1 mark)
• Provides contextual clarity (e.g., reflects how surprising the observed data are under the assumption of independence). (1 mark)
Question 2 (4–6 marks)
A researcher conducts a chi-square test for homogeneity to determine whether three different training programmes result in the same distribution of performance categories. The test yields a chi-square statistic of 12.4 with 6 degrees of freedom.
(a) Describe how the researcher would determine the p-value using a chi-square distribution table.
(b) Explain how technology could be used to obtain a more precise p-value.
(c) Interpret what a small p-value would indicate in the context of the study.
Question 2
(a)
• Identifies the need to use the row corresponding to 6 degrees of freedom. (1 mark)
• States that the test statistic (12.4) is compared across the table’s critical values to determine the interval in which the p-value lies. (1 mark)
(b)
• States that statistical technology (e.g., calculator or software) can compute the exact upper-tail probability using the chi-square statistic and degrees of freedom. (1 mark)
(c)
• Correctly interprets a small p-value as providing evidence against the null hypothesis. (1 mark)
• States that this suggests at least one programme results in a different distribution of performance categories. (1 mark)
• Provides clear contextual reasoning referring to the study of training programmes and performance categories. (1 mark)
