
Reaction pathway diagrams are fundamental in A-level Chemistry, offering a visual representation of the energy changes occurring in chemical reactions. These diagrams not only illustrate the pathway of a reaction but also highlight critical concepts like enthalpy changes and activation energy. This comprehensive guide will delve into constructing and interpreting these diagrams, crucial for any student aspiring to excel in chemistry.
Introduction to Reaction Pathway Diagrams
In chemistry, understanding the energy aspects of reactions is pivotal. Reaction pathway diagrams serve as a valuable tool in this regard, visually demonstrating how energy is either absorbed or released during a chemical process.
Key Components of the Diagrams
- Enthalpy (ΔH): This term refers to the heat content within a chemical system. It's a measure of the total energy, both kinetic and potential, possessed by the substances in the reaction. Enthalpy change indicates whether a reaction is exothermic (energy-releasing, ΔH negative) or endothermic (energy-absorbing, ΔH positive).
- Activation Energy (Ea): Representing the minimum energy threshold necessary to initiate a reaction, Ea is a critical concept. It's the energy required to break the initial bonds in the reactants, thus starting the chemical process.
Constructing Reaction Pathway Diagrams
To create an accurate and informative reaction pathway diagram, one must follow a structured approach.
Steps in Construction
1. Identifying Reactants and Products: Begin by noting the starting and ending materials of the reaction. This step sets the stage for understanding the energy flow.
2. Marking Energy Levels: Use the vertical axis to represent the energy levels of the reactants and products. The horizontal axis typically represents the progress of the reaction.
3. Indicating Enthalpy Change: Show whether the reaction is exothermic or endothermic by marking the difference in energy levels of the reactants and products.
4. Depicting Activation Energy: Illustrate Ea as a peak or barrier between the reactants and products. This peak visually represents the energy hurdle that must be overcome for the reaction to proceed.
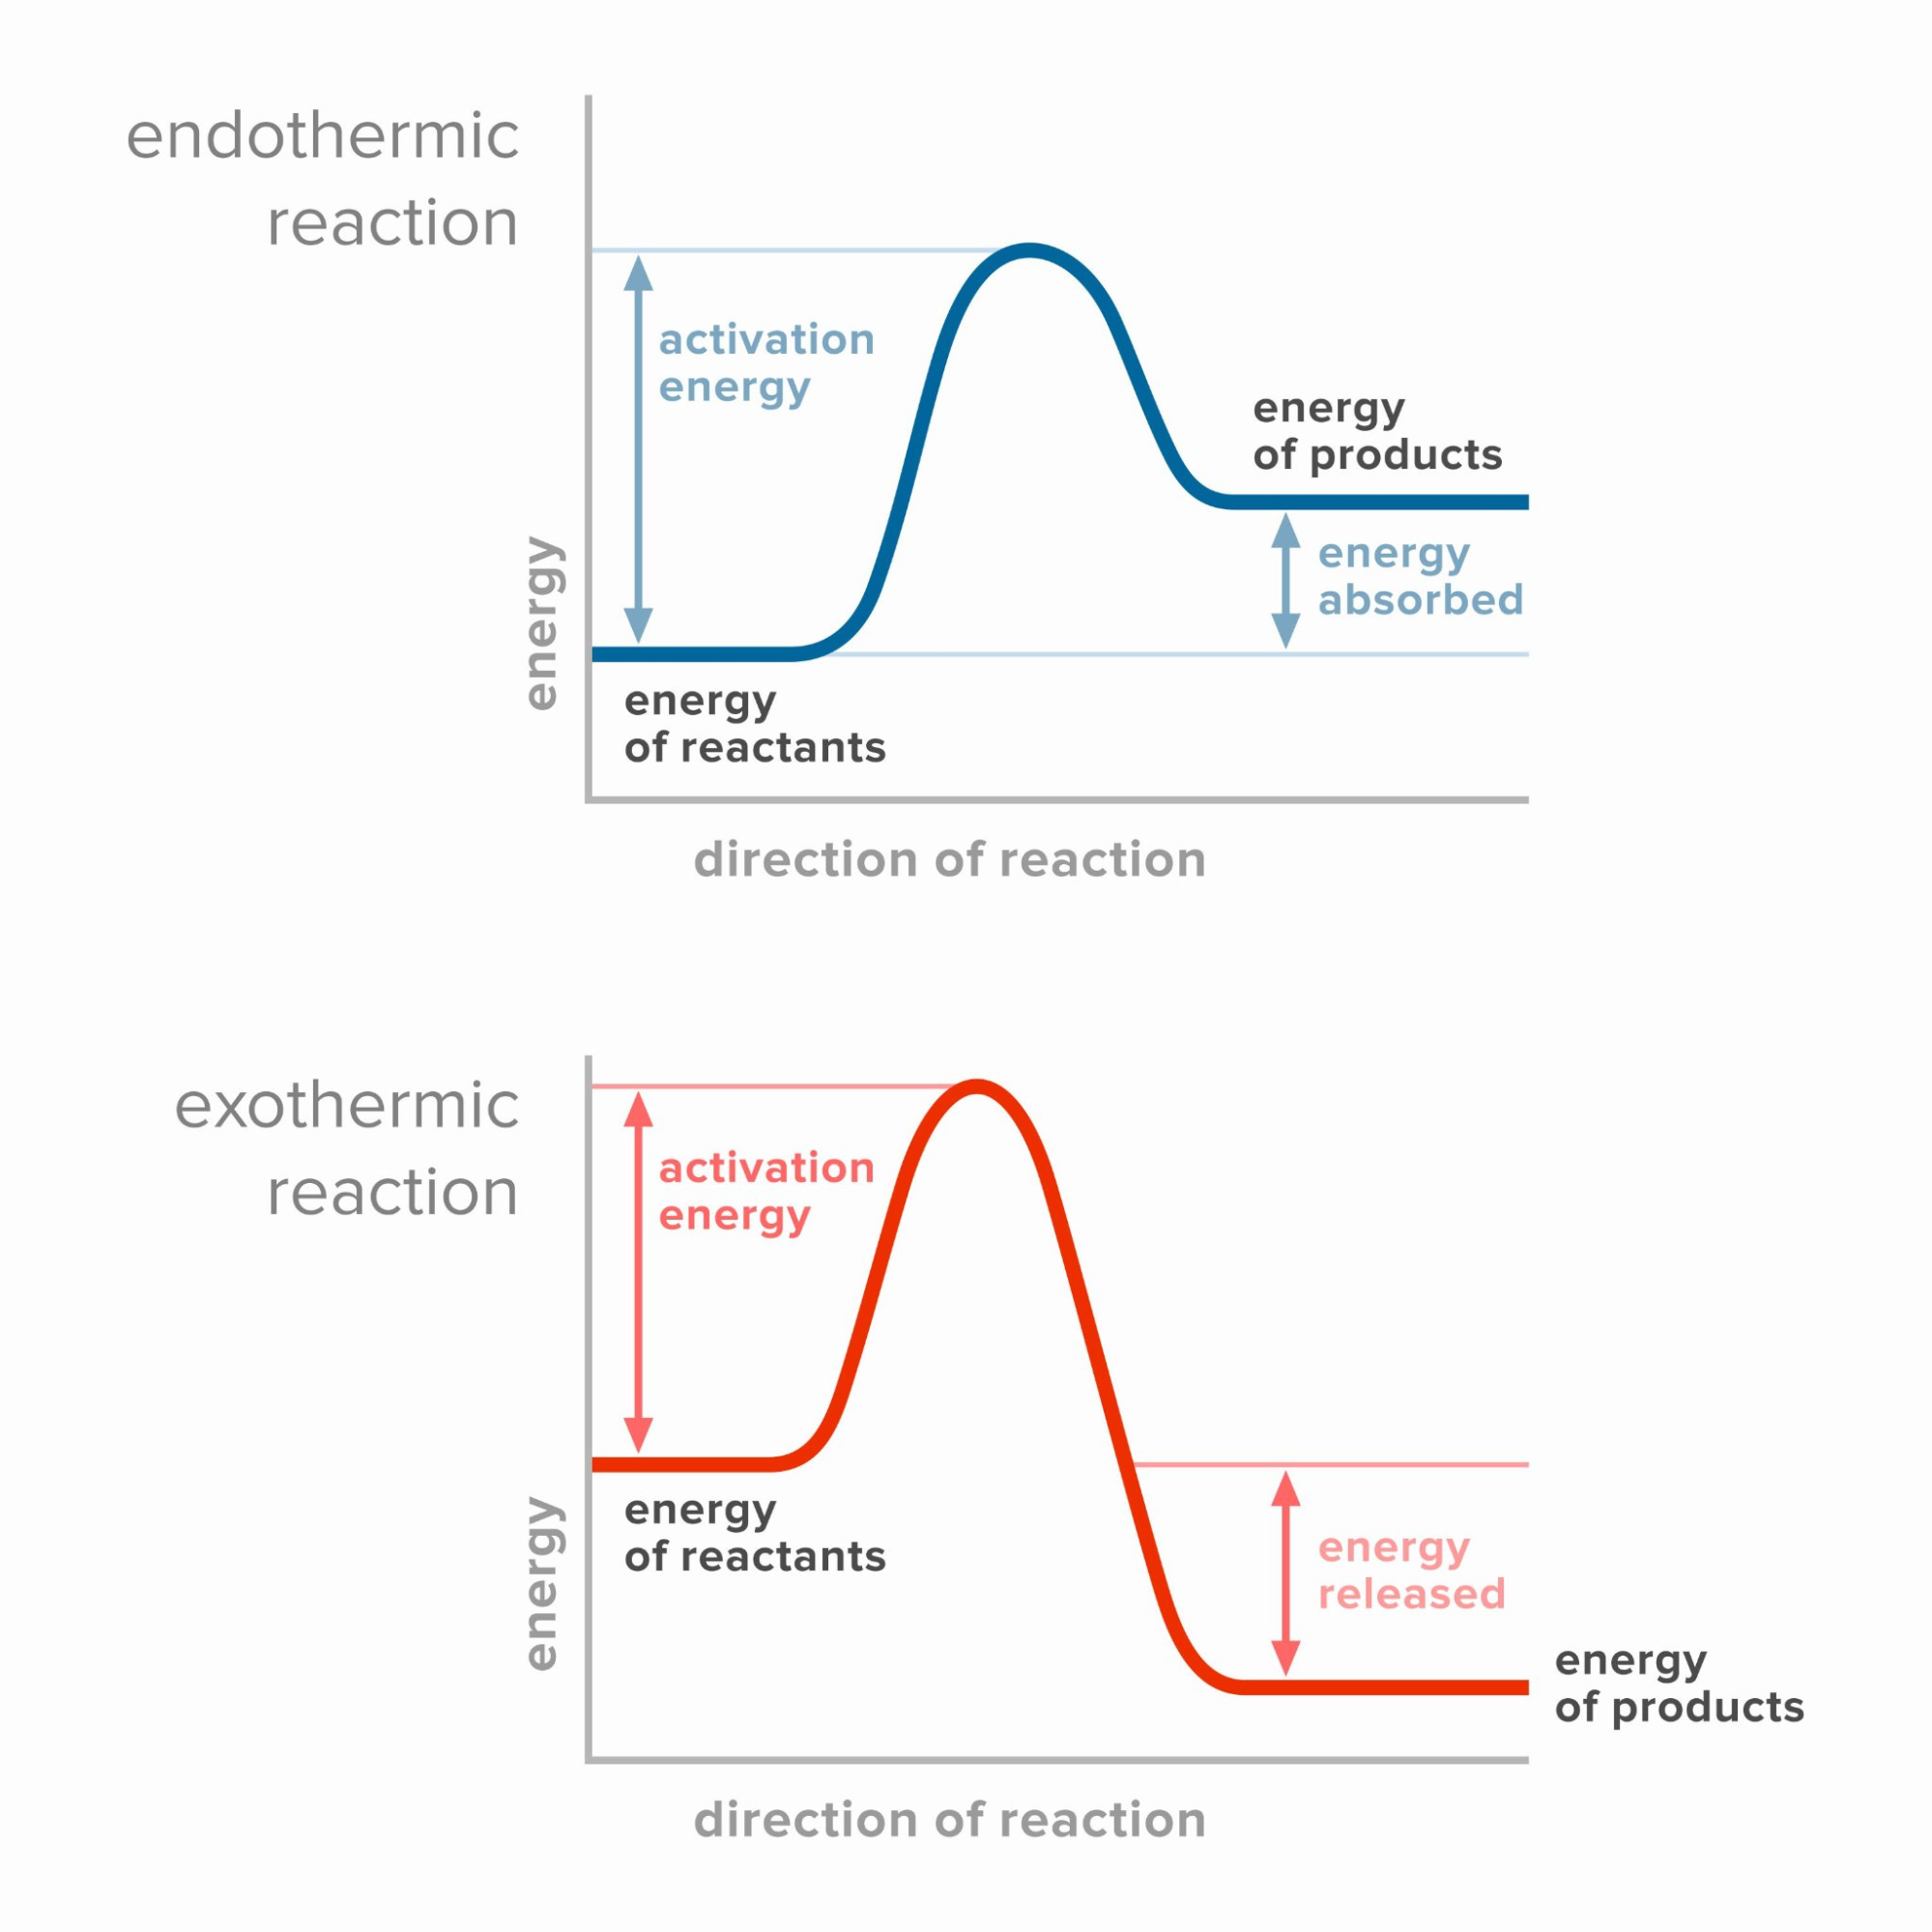
Image courtesy of Save My Exams
Interpreting Reaction Pathway Diagrams
Understanding these diagrams involves comprehending the energy dynamics of chemical reactions.
Distinguishing Reaction Types
- Exothermic Reactions: These reactions exhibit a net release of energy, often in the form of heat or light. In the diagram, they are depicted with a downward slope from reactants to products, reflecting a decrease in energy. The ΔH value is negative, indicating that the system has lost energy to the surroundings.
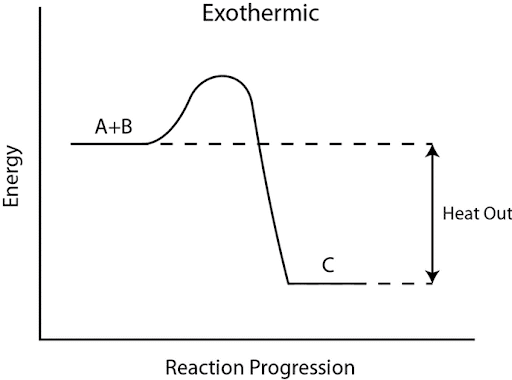
Image courtesy of Brazosport College
- Endothermic Reactions: Contrary to exothermic reactions, endothermic reactions absorb energy from the surroundings. This absorption is shown as an upward slope in the diagram. The energy level of the products is higher than that of the reactants, and ΔH is positive.
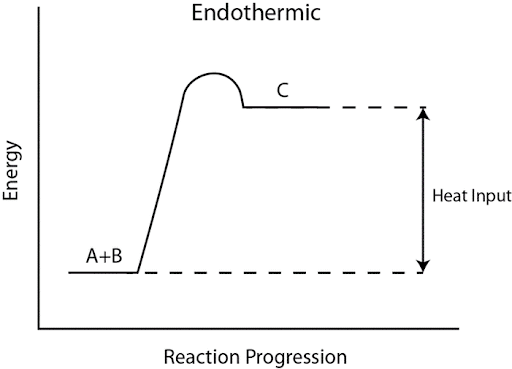
Image courtesy of Brazosport College
Activation Energy's Role
- Lower Ea: A lower activation energy suggests that the reaction can occur more readily, as less energy is required to initiate the process.
- Higher Ea: Conversely, a higher Ea indicates a greater energy requirement to start the reaction, often leading to slower reaction rates without additional energy input or the use of a catalyst.
Examples and Applications
Example: Exothermic Reaction
Consider a simple combustion reaction, like burning methane. The diagram would show reactants (methane and oxygen) at a higher energy level than the products (carbon dioxide and water). The area between the reactants and the peak represents the Ea, and the downward slope reflects the energy release (ΔH negative).
Example: Endothermic Reaction
In an endothermic reaction like photosynthesis, the energy level of the products (glucose and oxygen) is higher than that of the reactants (carbon dioxide and water). The diagram shows an upward slope, indicating energy absorption from the surroundings (ΔH positive).
Practical Applications
- Predicting Reaction Feasibility: By analysing ΔH and Ea, chemists can predict whether a reaction is likely to occur under given conditions.
- Catalyst Influence: Catalysts play a crucial role in lowering Ea, thus making reactions more feasible. They are depicted in diagrams as a lower peak, indicating a reduced energy barrier.

Image courtesy of nigerianscholars.com
Limitations of Reaction Pathway Diagrams
While reaction pathway diagrams are informative, they have limitations:
- Lack of Mechanistic Detail: These diagrams do not provide information about the mechanism of the reaction or the intermediate states.
- No Rate Information: They do not directly indicate the speed or rate of the reaction.
FAQs on Reaction Pathway Diagrams
What does the peak in the diagram signify?
The peak represents the activation energy (Ea), which is the minimum energy required to initiate the reaction.
How can one identify an exothermic reaction in these diagrams?
An exothermic reaction is indicated by a downward slope from reactants to products, showing a decrease in energy and a negative ΔH.
Do these diagrams indicate the rate of a reaction?
No, reaction pathway diagrams illustrate energy changes but do not provide direct information about the reaction rate.
In summary, reaction pathway diagrams are essential tools for understanding the energy changes in chemical reactions. They aid in visualising whether a reaction is exothermic or endothermic and the amount of activation energy required. These diagrams are foundational in the study of chemistry, providing insights into the energetics of chemical reactions. Remember, the key to mastering these diagrams lies in the details – the positioning of reactants, products, and the Ea peak, each narrating a unique aspect of the reaction's energy dynamics.
Practice Questions
An exothermic reaction pathway diagram typically starts with the reactants at a higher energy level compared to the products, indicating the release of energy. The activation energy (Ea) is depicted as a peak which the reactants must overcome to proceed to the products. The peak is higher than the reactants' energy level, signifying the energy input required to initiate the reaction. The diagram slopes downwards from the reactants to the products, illustrating the decrease in energy and a negative ΔH, which is a hallmark of exothermic reactions. This negative ΔH signifies the overall release of energy to the surroundings, a characteristic feature of exothermic processes.
In an endothermic reaction, the reaction pathway diagram shows the reactants at a lower energy level than the products. This difference in energy levels is depicted by an upward slope, indicating that energy is absorbed from the surroundings. The activation energy (Ea) appears as a peak, which is essential to overcome for the reaction to proceed. This peak is notably higher than the energy level of both reactants and products, emphasising the significant energy input needed. The enthalpy change (ΔH) in an endothermic reaction is positive, reflecting the overall gain of energy by the system from its surroundings. This positive ΔH is a key indicator of the energy absorption characteristic of endothermic reactions.
FAQ
In a reaction pathway diagram, the presence of a catalyst is represented by a lower activation energy peak. Catalysts function by providing an alternative pathway for the reaction with a lower activation energy. This does not change the initial and final energy levels of the reactants and products (and thus does not alter the overall ΔH of the reaction), but it lowers the energy barrier that needs to be overcome. The result is a diagram with a noticeably lower peak compared to the same reaction without a catalyst. This visual representation helps understand the role of catalysts in increasing the rate of a reaction. They do this by allowing more reactant molecules to possess the necessary energy to reach the transition state, thus leading to an increased rate of reaction.
In reaction pathway diagrams, the stability of reactants and products in endothermic and exothermic reactions is inferred from their relative energy levels. In exothermic reactions, the products are at a lower energy level than the reactants, indicating that they are more stable. The release of energy in these reactions is a result of the system transitioning to a more stable state. Conversely, in endothermic reactions, the products are at a higher energy level than the reactants, suggesting they are less stable. These reactions require energy input to proceed because they move towards a less stable state. Stability here is related to the potential energy of the molecules; more stable molecules have lower potential energy. Therefore, in exothermic reactions, the conversion to more stable products releases energy, while in endothermic reactions, the formation of less stable products requires energy input.
While reaction pathway diagrams provide valuable insights into the energetics of reactions, they have limitations in explaining dynamic equilibria. These diagrams typically illustrate the initial and final states of a reaction and the activation energies involved but do not show the continuous, dynamic process of reactants converting to products and vice versa that characterises equilibrium. They do not depict the rate at which the forward and reverse reactions occur or how these rates change over time to reach equilibrium. Furthermore, these diagrams do not indicate the concentrations of reactants and products at equilibrium or how these concentrations might shift with changes in external conditions like temperature and pressure. To fully understand dynamic equilibria, one needs to consider factors like reaction rates, concentrations, and the principles of Le Chatelier's principle, which are beyond the scope of a simple energy profile diagram.
Yes, reaction pathway diagrams can be effectively used to compare the activation energies of different reactions. By examining the height of the activation energy peak in these diagrams, chemists can gauge the relative energy barriers that different reactions must overcome. A higher peak suggests a greater activation energy, indicating that more energy is required to initiate the reaction. Conversely, a lower peak implies a lower activation energy, suggesting that the reaction can proceed more readily. This comparative analysis is particularly useful in understanding why certain reactions occur faster than others under similar conditions and why some reactions need catalysts to proceed at a practical rate. However, it's important to note that these diagrams don't provide the actual numerical values of activation energy but give a visual comparative understanding. For precise measurements, other analytical methods and calculations are required.
In a reversible reaction, the reaction pathway diagram is unique as it illustrates both the forward and reverse reactions. Typically, such a diagram will have two peaks representing the activation energies for both directions of the reaction. The first peak corresponds to the activation energy of the forward reaction, while the second represents that of the reverse reaction. Between these peaks, there will often be a trough, indicating the intermediate state where the reactants have partially converted to products. The energy level of this intermediate state is crucial, as it determines the equilibrium position of the reaction. If the energy level of the intermediate state is closer to the reactants, the reaction favours the forward process, and if it's closer to the products, the reverse reaction is favoured. The diagram also displays the enthalpy changes for both the forward and reverse reactions, which are crucial in determining the spontaneity and feasibility of the reaction under varying conditions.
