
Random and systematic errors
Random errors cause unpredictable variation between repeated measurements and mainly reduce precision.
Repeating measurements and calculating a mean reduces the effect of random variation on the final result.
Systematic errors shift measurements consistently away from the true value and mainly reduce accuracy.
Repeating measurements does not remove a systematic error because the same bias remains.
A zero error or incorrect calibration can produce a systematic offset.
Identify the error type before suggesting how it should be reduced or removed.
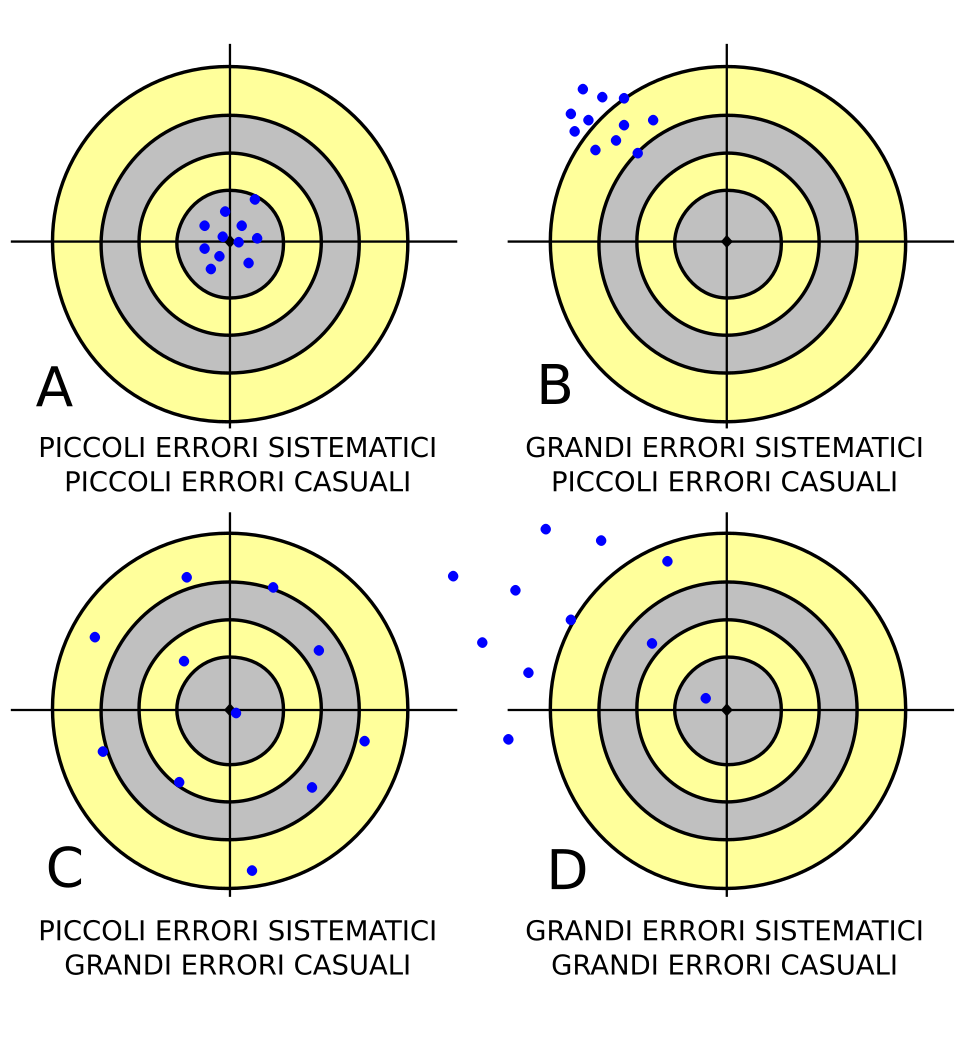
Systematic uncertainty produces a consistent displacement, whereas random uncertainty produces a spread of measurements. Repetition reduces the effect of random variation but does not remove a systematic offset. Source
Repeatability and reproducibility
Repeatability means obtaining similar results when the same method, investigator and equipment are used under the same conditions.
Reproducibility means obtaining similar results when the investigation is repeated using different investigators or equipment.
Good repeatability shows that repeated measurements under closely matched conditions have little unexplained variation.
Good reproducibility gives stronger evidence that the result does not depend strongly on one particular setup or investigator.
Expressing uncertainty
Absolute uncertainty can be written with a measurement as and has the same unit as the measured quantity.
Fractional uncertainty is .
Percentage uncertainty is .
A larger fractional or percentage uncertainty means the measurement is less precise relative to its size.
Use uncertainty to communicate the reasonable range within which the measured value may lie.
Uncertainty must be carried through calculations to represent uncertainty in the final derived quantity.
Significant figures and uncertainty
The number of reported significant figures must be consistent with the measurement's uncertainty.
Quote the measured value to the same decimal place as its absolute uncertainty.
Do not report extra digits that imply greater precision than the measurement supports.
Smaller uncertainty may justify more significant digits, but additional digits cannot make an inaccurate experiment accurate.
Checklist: can you do this?
Can you distinguish random and systematic errors and suggest how each can be reduced or removed?
Can you distinguish accuracy, precision, repeatability, reproducibility and resolution?
Can you calculate absolute, fractional and percentage uncertainties and combine them correctly?
Can you interpret error bars and determine uncertainties in a straight-line gradient and intercept?
Can you estimate physical quantities and derived results to the nearest order of magnitude?
Accuracy, precision and resolution
Accuracy describes how close a measurement is to the true or accepted value.
Precision describes how closely repeated measurements agree with each other.
High precision does not guarantee high accuracy because a systematic error can shift every reading.
Resolution is the smallest change in a quantity that a measuring instrument can distinguish.
Better resolution can allow smaller changes to be detected, but it does not automatically remove other measurement errors.
Reducing measurement errors
Reduce random error by taking repeated readings and using their mean where appropriate.
Improve control of experimental conditions when uncontrolled variation causes readings to fluctuate.
Reduce systematic error by checking calibration, correcting zero errors or replacing faulty equipment.
Compare measuring equipment with a known reference where this can reveal a consistent offset.
Do not claim that repetition removes systematic error; repeated biased readings remain biased.
Choose measuring equipment with sufficient resolution for the change being investigated.
Combining uncertainties
For addition or subtraction, add the absolute uncertainties: .
For multiplication or division, add fractional uncertainties: .
Percentage uncertainties may be added instead when quantities are multiplied or divided.
If , the fractional uncertainty is .
Therefore, raising a measured quantity to a power multiplies its percentage uncertainty by the magnitude of that power.
Combinations involving trigonometric or logarithmic functions are not required for this syllabus section.
Error bars and graph uncertainties
Error bars represent uncertainty in individual plotted data values.
Error bars may be vertical, horizontal or both, depending on which plotted quantities have uncertainty.
Individual points on a graph may or may not have associated error bars.
Use steepest and shallowest acceptable straight lines to determine the possible range of gradient.
A common gradient uncertainty calculation is .
Similarly, the intercept uncertainty can be obtained from .
Interpret larger uncertainty ranges as weaker constraints on the gradient or intercept.
Orders of magnitude and estimation
An order of magnitude represents the scale of a quantity using the nearest power of ten.
Write an approximate value in the form to identify its scale.
Use physically sensible assumptions rather than attempting unjustified precision.
Round an approximate physical quantity to its nearest order of magnitude when required.
For a derived estimate, combine reasonable approximate values using an appropriate physical relationship.
Check that the final estimate has a sensible scale and does not contain false precision.
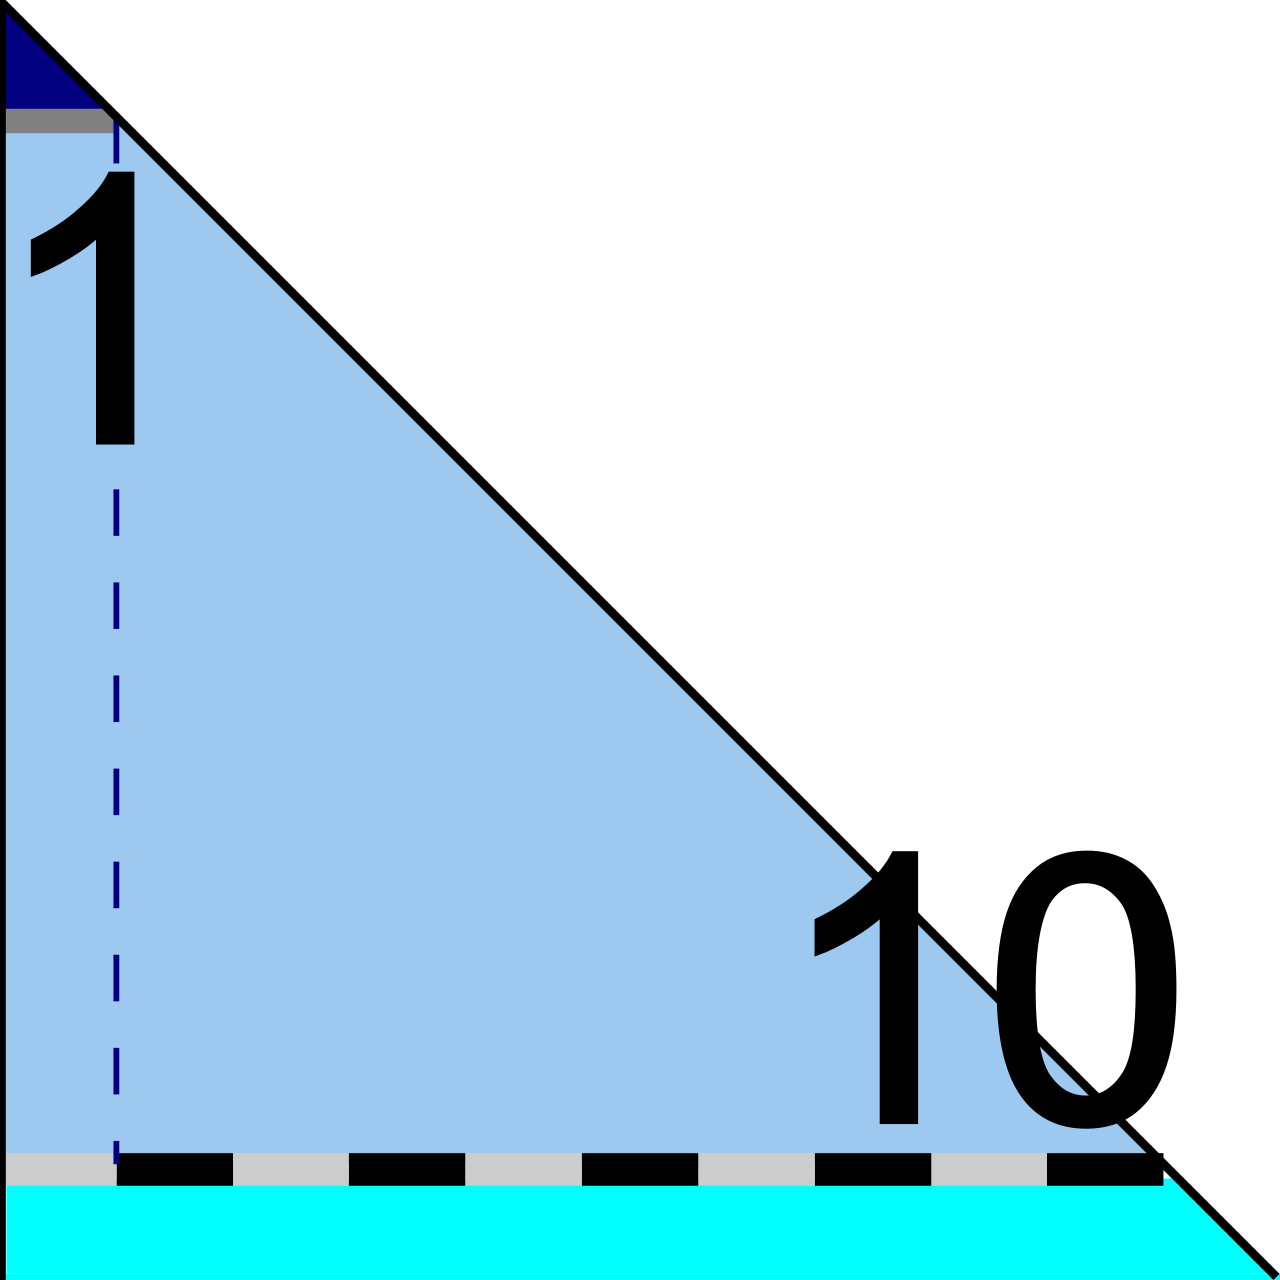
Each successive order of magnitude differs by a factor of . Thinking in factors of helps judge whether an estimated physical quantity has a sensible scale. Source