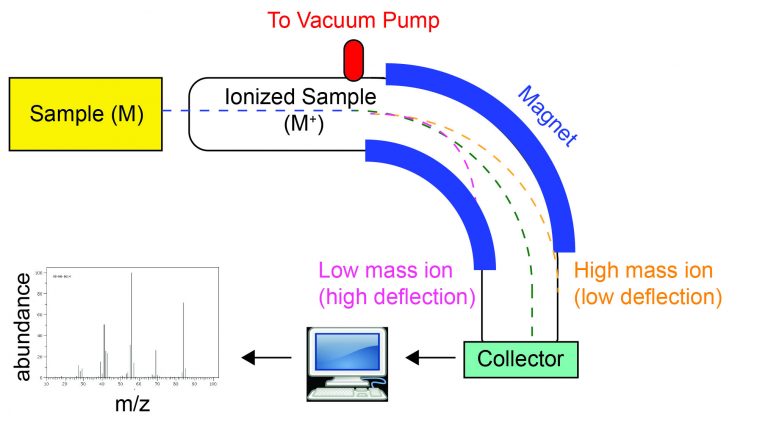
Interpreting a mass spectrum
· A mass spectrum shows peaks for ions with different m/e values and their relative abundances.
· m/e = mass-to-charge ratio; in CIE questions, most ions have charge +1, so m/e usually equals relative mass.
· The x-axis shows m/e values; the y-axis shows relative abundance.
· The base peak is the tallest peak and is assigned 100% relative abundance.
· Other peaks are compared with the base peak, not necessarily with the molecular ion peak.
· A peak at a lower m/e often represents a fragment ion formed when a molecule breaks apart.
Isotopic abundances and relative atomic mass
· Isotopes of an element appear as separate peaks because they have different masses.
· The height of each isotope peak shows its relative abundance.
· To calculate relative atomic mass, Aᵣ, use the weighted mean:
· Aᵣ = Σ(isotopic mass × relative abundance) ÷ Σ(relative abundance)
· If abundances are percentages: Aᵣ = Σ(isotopic mass × % abundance) ÷ 100.
· Exam tip: do not simply average isotope masses unless the abundances are equal.
Isotope peaks allow relative atomic mass to be calculated as a weighted average. The larger the peak, the greater the isotope’s contribution to the final Aᵣ value. Source
Molecular ion peak, M⁺
· The molecular ion peak, written M⁺, is caused by the whole molecule losing one electron.
· The m/e value of M⁺ gives the relative molecular mass, Mᵣ, of the organic molecule.
· The M⁺ peak is usually the peak with the highest significant m/e value in the molecular ion region.
· Ignore very small peaks just above M⁺ unless the question is asking about M + 1 or M + 2 peaks.
· If M⁺ = 72, then the compound has Mᵣ = 72.
Fragmentation
· Fragmentation = breaking of the molecular ion into smaller positive ions and neutral particles.
· Only charged positive fragments are detected in the mass spectrum.
· Common fragment ions can suggest parts of the molecule, e.g. CH₃⁺ = m/e 15, C₂H₅⁺ = m/e 29, C₃H₇⁺ = m/e 43.
· A question may ask you to suggest the identity of a fragment from its m/e value.
· Method: match the m/e value to a possible ion formula using relative atomic masses.
· Example: peak at m/e 43 could be C₃H₇⁺ because 3(12) + 7(1) = 43.
Fragment peaks are produced when the molecular ion breaks into smaller positive ions. The m/e values of these peaks can be used to suggest possible fragment formulas. Source
The M + 1 peak and number of carbon atoms
· The [M + 1]⁺ peak is mainly due to molecules containing one ¹³C atom instead of ¹²C.
· Natural abundance of ¹³C ≈ 1.1%, so larger molecules with more carbon atoms give a larger M + 1 peak.
· CIE formula:
· n = (100 × abundance of [M + 1]⁺ ion) ÷ (1.1 × abundance of M⁺ ion)
· n = number of carbon atoms in the compound.
· Always use the relative abundances of [M + 1]⁺ and M⁺, not their m/e values.
· Round n to a whole number because a molecule must contain a whole number of carbon atoms.
The M + 2 peak: chlorine and bromine
· The [M + 2]⁺ peak helps identify chlorine or bromine in an organic molecule.
· Chlorine has two main isotopes: ³⁵Cl and ³⁷Cl.
· One chlorine atom gives M : M + 2 ≈ 3 : 1.
· Bromine has two main isotopes: ⁷⁹Br and ⁸¹Br.
· One bromine atom gives M : M + 2 ≈ 1 : 1.
· The M + 2 peak is two m/e units higher than the molecular ion peak because the heavier isotope is 2 mass units heavier.
· Exam tip: a strong M + 2 peak is a major clue for halogen-containing organic compounds.
Chlorine gives an M and M+2 pattern in an approximate 3:1 ratio, while bromine gives an approximate 1:1 ratio. These patterns are caused by naturally occurring isotopes of chlorine and bromine. Source
Exam method for mass spectra questions
· First identify the M⁺ peak to find Mᵣ.
· Check for M + 1 to estimate the number of carbon atoms.
· Check for M + 2 to identify Cl or Br.
· Use fragment peaks to suggest possible ions.
· Use relative abundance data to calculate Aᵣ for elements.
· Keep calculations clear: write the formula, substitute values, then round appropriately.
Common mistakes to avoid
· Do not confuse the base peak with the molecular ion peak.
· Do not use peak m/e values instead of peak abundances in the carbon-number formula.
· Do not assume every peak is an isotope peak; in organic spectra, many peaks are fragment ions.
· Do not include neutral fragments when explaining peaks because neutral particles are not detected.
· Do not describe the working of the mass spectrometer; CIE states this is not required for this topic.
Checklist: can you do this?
· Interpret m/e values and isotopic abundances from a mass spectrum.
· Calculate relative atomic mass from isotope masses and abundances.
· Deduce Mᵣ from the molecular ion peak, M⁺.
· Suggest fragment ions from simple fragmentation peaks.
· Use M + 1 and M + 2 peaks to identify carbon number, chlorine, and bromine.