Rate of reaction
· Rate of reaction = how fast reactants are used up or products are formed.
· Rate is measured by the change in amount/concentration/volume/mass per unit time.
· Common units: mol dm⁻³ s⁻¹, cm³ s⁻¹, g s⁻¹ or s⁻¹, depending on the data given.
· A reaction is faster when the measured quantity changes more rapidly in the same time.
· On a graph, steeper gradient = faster rate.
· As a reaction proceeds, rate usually decreases because reactant concentration decreases.
This graph shows how concentration changes with time during a reaction. The rate at a specific time is found from the gradient of the curve, using a tangent. A steeper tangent means a faster reaction rate. Source
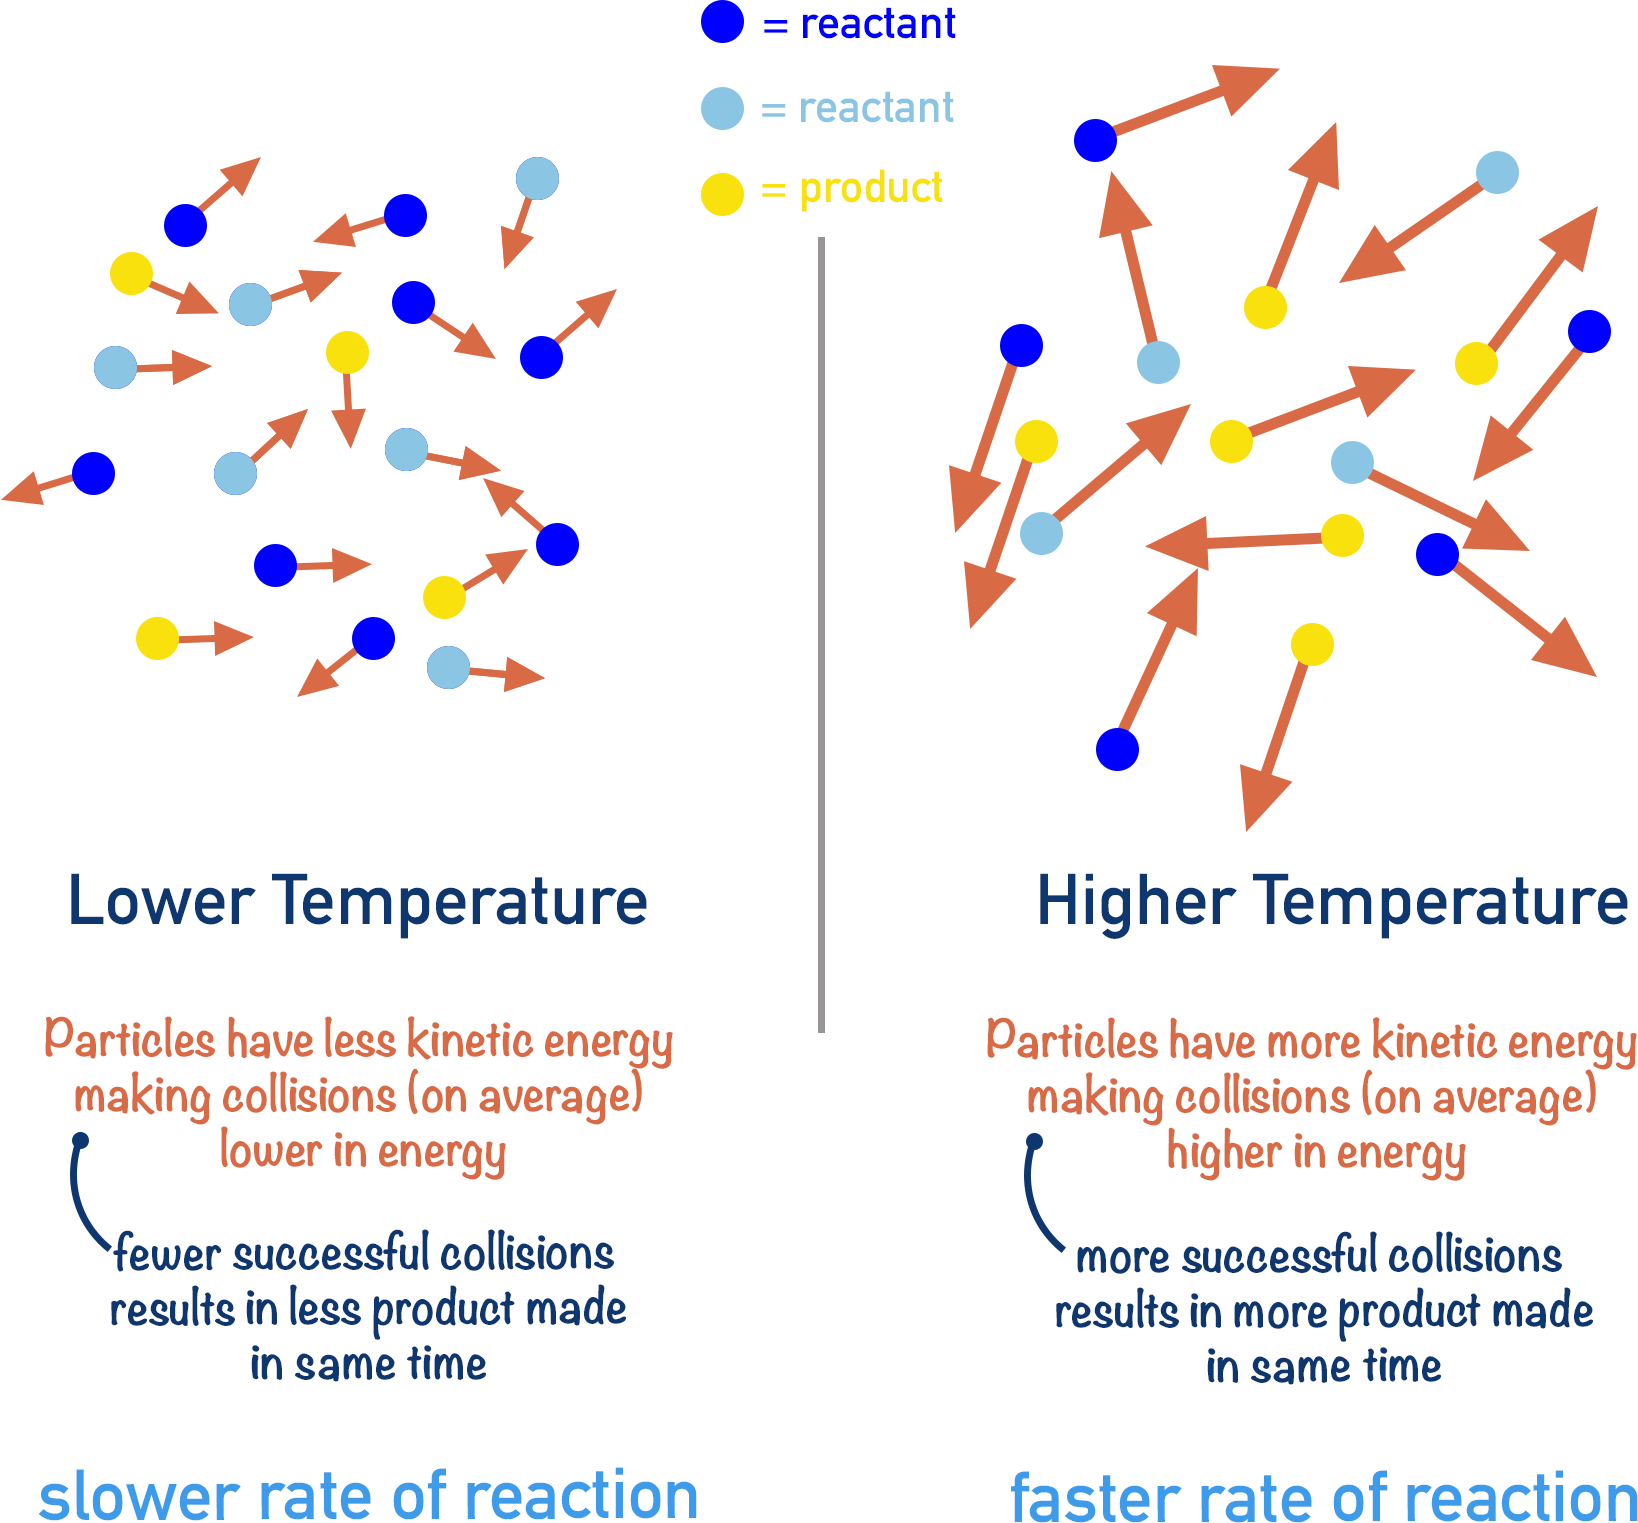
Collision theory
· Collision theory explains reaction rate in terms of particles colliding.
· For a reaction to occur, particles must have an effective collision.
· Effective collision = collision that leads to a chemical reaction/product formation.
· Non-effective collision = collision where particles collide but no reaction occurs.
· A higher frequency of effective collisions means a faster reaction.
· Many collisions are non-effective, so not every collision produces products.
· Exam phrase: “The rate increases because there are more frequent effective collisions per unit time.”
Effect of concentration on rate
· Increasing concentration increases the number of reactant particles per unit volume.
· Particles are closer together, so they collide more frequently.
· This increases the frequency of effective collisions.
· Therefore, increasing concentration usually increases the rate of reaction.
· Decreasing concentration causes fewer effective collisions per unit time, so rate decreases.
· Best exam wording: “Higher concentration gives more particles per unit volume, causing more frequent effective collisions, so the reaction is faster.”
Effect of pressure on rate
· Pressure only affects rate significantly for reactions involving gases.
· Increasing pressure compresses gas particles into a smaller volume.
· Gas particles become closer together, so collision frequency increases.
· This gives more frequent effective collisions per unit time.
· Therefore, increasing pressure usually increases the rate of reaction for gases.
· Decreasing pressure causes fewer collisions per unit time, so rate decreases.
This diagram compares gas particles at low and high pressure. At higher pressure, particles are closer together, causing more frequent collisions and therefore a faster rate of reaction. Source
Calculating rate from experimental data
· Use: rate = change in quantity ÷ time taken.
· If a reactant is measured: rate = decrease in reactant ÷ time.
· If a product is measured: rate = increase in product ÷ time.
· From a graph, calculate rate using the gradient.
· For a straight-line section: gradient = change in y ÷ change in x.
· For a curve, draw a tangent at the required time and calculate its gradient.
· Always include the correct units from the axes or data table.
· Exam tip: if the graph shows reactant concentration decreasing, the gradient is negative, but reaction rate is usually reported as a positive value.
Common experimental measurements of rate
· Gas produced: measure volume of gas over time using a gas syringe.
· Mass lost: measure decrease in mass over time when a gas escapes.
· Colour change: measure change using a colorimeter if a coloured substance is involved.
· Precipitate formation: measure time for a mark to disappear, but this gives an approximate rate.
· Concentration change: use titration or sampling methods to find concentration at different times.
· The chosen method must measure a quantity that changes as the reaction proceeds.

This image shows how gas production can be followed during a reaction. Measuring gas volume at regular time intervals allows students to calculate the rate of reaction from experimental data. Source
Exam command-word phrases
· Explain rate increase: “There are more frequent effective collisions per unit time.”
· Explain concentration effect: “More particles per unit volume causes more frequent effective collisions.”
· Explain pressure effect: “Gas particles are closer together, so collisions occur more often.”
· Calculate rate: “Rate = change in measured quantity ÷ time.”
· Interpret graph: “A steeper gradient shows a faster rate.”
· Curve levels off: “The reaction has finished / reactant has been used up / no further product is formed.”
Checklist: can you do this?
· Define rate of reaction, frequency of collisions, effective collisions and non-effective collisions.
· Explain how concentration changes rate using frequency of effective collisions.
· Explain how pressure changes the rate of reactions involving gases.
· Calculate rate from experimental data, including correct units.
· Interpret rate from a graph using gradient or a tangent.