What rate of reaction means
Rate of reaction = change in concentration of a reactant or product per unit time.
For reactants, concentration decreases; for products, concentration increases.
Units often used: mol dm s, cm s, g s depending on the data provided.
In exams, rate is commonly found from:
gradient of a graph
average rate over a time interval
instantaneous rate using a tangent
Always check whether the graph is concentration–time, volume–time or mass–time before calculating.
Measuring rate experimentally
Rate is rarely measured directly as concentration change.
Common practical methods:
Gas volume collected vs time
Mass loss vs time when gas escapes
Colour / opacity change vs time
Sampling + titration at intervals
If time is the dependent variable, you often compare time taken for a fixed change.
If time is the independent variable, you track how some measurable quantity changes with time.
Steeper gradient = faster reaction.
A tangent gives instantaneous rate at one point; a chord between two points gives average rate.
In practical design, keep all other variables constant when testing one factor.
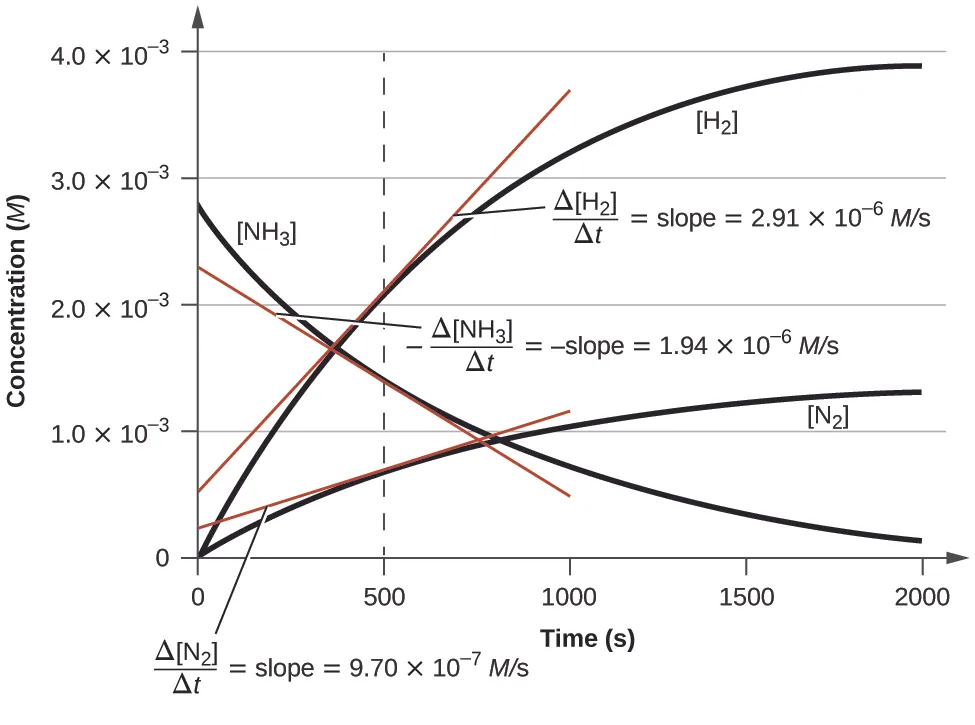
This image shows how reactant and product concentrations change with time and how the slope of a tangent gives instantaneous rate. It is useful for IB questions on reading rate from graphs and relating slopes to stoichiometric ratios. Source
Collision theory
A reaction happens only when particles collide.
Not every collision is successful.
A successful collision must have:
sufficient energy to overcome activation energy,
correct orientation so bonds can break/form in the right way
Higher temperature means higher average kinetic energy, so more particles can react.
Collision geometry / orientation matters: even energetic collisions may fail if particles are aligned wrongly.
Factors that affect rate
Concentration: higher concentration means more particles per unit volume, so more frequent collisions.
Pressure (for gases): higher pressure means particles are closer together, so collision frequency increases.
Surface area: greater surface area means more exposed particles, so more collisions can occur.
Temperature: increases both collision frequency and the fraction of particles with energy .
Catalyst: increases rate by giving an alternative pathway with lower .
Exam rule: when explaining any factor, link it to collision frequency, energy, or successful collisions.
Activation energy and Maxwell–Boltzmann distributions
Activation energy, = minimum energy needed for a collision to lead to reaction.
On an energy profile, is the energy gap from reactants to the peak.
The peak represents the transition state / activated complex.
A Maxwell–Boltzmann distribution shows the spread of particle energies in a sample.
Area under the curve to the right of = fraction of particles able to react.
When temperature increases:
the curve becomes lower and broader
the peak shifts right
the area beyond increases a lot
This explains why a small increase in temperature can cause a large increase in rate.
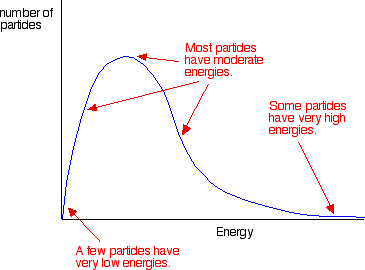
This image shows that only particles with energy to the right of can react. It helps explain why raising temperature increases the fraction of successful collisions, not just the number of collisions. Source
Catalysts
A catalyst increases reaction rate by providing an alternative reaction pathway with lower .
A catalyst does not change of the reaction.
A catalyst is not used up overall.
In equilibrium contexts, catalysts speed up both forward and backward reactions equally.
On an energy profile:
reactant and product energy stay the same
the peak is lower
On Maxwell–Boltzmann diagrams, a catalyst is shown by moving the line left, increasing the area beyond it.
Enzymes are biological catalysts.
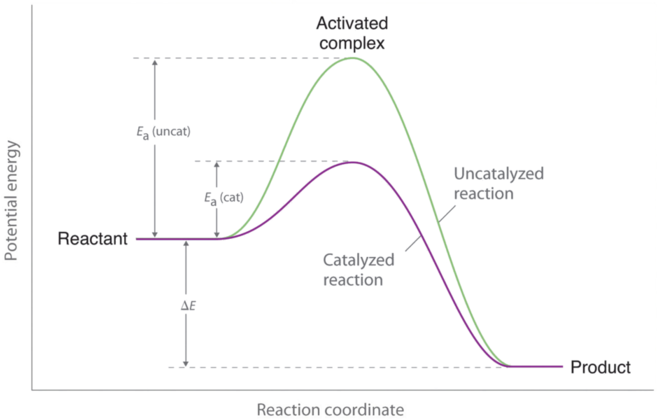
This image shows that a catalyst lowers but does not change the overall energy difference between reactants and products. It is very useful for explaining catalyst questions in both SL and HL. Source
HL only – Reaction mechanisms, intermediates and the rate-determining step
Many reactions occur in a series of elementary steps.
The slowest step is the rate-determining step (RDS).
The overall mechanism must be consistent with:
the overall equation
the experimental rate equation
any stated kinetic data
An intermediate:
is formed in one step and used up in a later step
does not appear in the overall equation
A transition state:
is the highest-energy state during a step
appears at the peak of an energy profile
is not isolatable
Be able to distinguish:
intermediate = species between steps
transition state = energy maximum during a step
The RDS is not always the first step.
Molecularity of an elementary step:
unimolecular = 1 reacting particle
bimolecular = 2 reacting particles
termolecular = 3 reacting particles
HL only – Rate equations and reaction order
A rate equation has the form: rate =
The exponents are the orders with respect to each reactant.
Overall order = sum of all exponents.
Orders are determined experimentally, not from the balanced equation.
Order can suggest how many particles are involved in the RDS, but only for a proposed mechanism.
Typical graph shapes:
Zero order:
rate–concentration graph = horizontal line
concentration–time graph = straight decreasing line
First order:
rate–concentration graph = straight line through origin
concentration–time graph = curved exponential decay
Second order:
rate–concentration graph = upward curve
concentration–time graph = steeper curve at start, then levels off
Strategy for experimental data:
compare trials where only one concentration changes
see how the rate changes
deduce the exponent from the pattern
Rate constant, depends on temperature.
Units of depend on overall order.
HL only – Arrhenius equation
The Arrhenius equation links rate constant and temperature:
Meanings:
= rate constant
= Arrhenius factor / frequency factor
= activation energy
= gas constant
= temperature in K
As temperature increases, increases.
reflects how often collisions occur with correct orientation.
Linear form:
For a graph of against :
slope =
intercept =
Therefore you can calculate:
from the slope
from the intercept
Exam warning: use Kelvin, and keep units consistent for and .
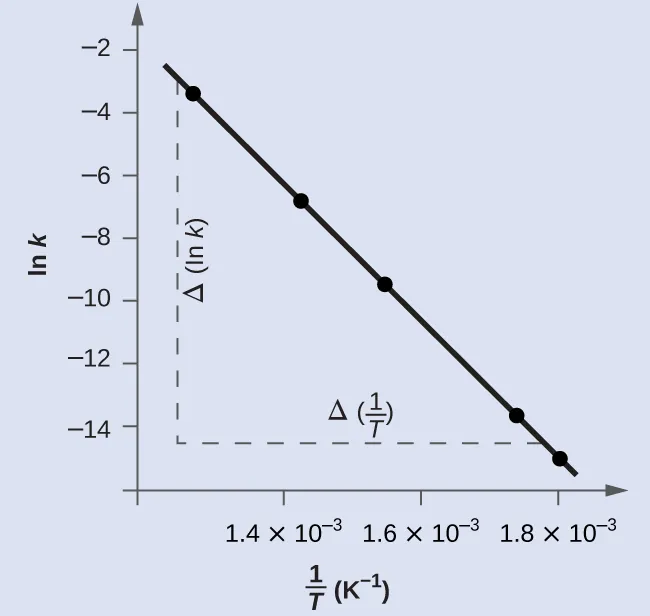
This image shows the linear Arrhenius plot used to calculate activation energy from the gradient. It is the key diagram for HL data analysis on temperature dependence of rate. Source
Checklist: can you do this?
Calculate rate from a graph, including using a tangent for instantaneous rate.
Explain rate changes using collision theory, , and successful collisions.
Sketch and interpret energy profiles and Maxwell–Boltzmann distributions with and without a catalyst.
HL: Deduce a rate equation and reaction order from experimental data.
HL: Use an Arrhenius plot to determine and interpret .
Common exam traps
Do not say rate increases just because particles move faster; link it to more frequent and/or more successful collisions.
Do not confuse with .
Do not derive reaction order from the balanced equation unless told the reaction is elementary.
Do not forget that a catalyst changes rate, not the position of equilibrium.
In HL data questions, always check units of , slope, , and temperature in K.