Stellar equilibrium and fusion
Stars are stable when inward gravitational force is balanced by outward radiation/gas pressure from the hot interior (hydrostatic equilibrium).
Fusion is the source of stellar energy: light nuclei combine to form heavier nuclei, and the mass defect is released as energy: .
In main-sequence stars, the dominant process is hydrogen fusion to helium in the core.
Fusion requires very high temperature and density so nuclei have enough kinetic energy to overcome electrostatic repulsion.
If fusion rate rises, pressure increases and expansion tends to reduce the rate; if fusion rate falls, contraction raises core temperature and tends to increase the rate.
Higher-mass stars have higher core temperatures, fuse fuel faster, are more luminous, and have shorter lifetimes.
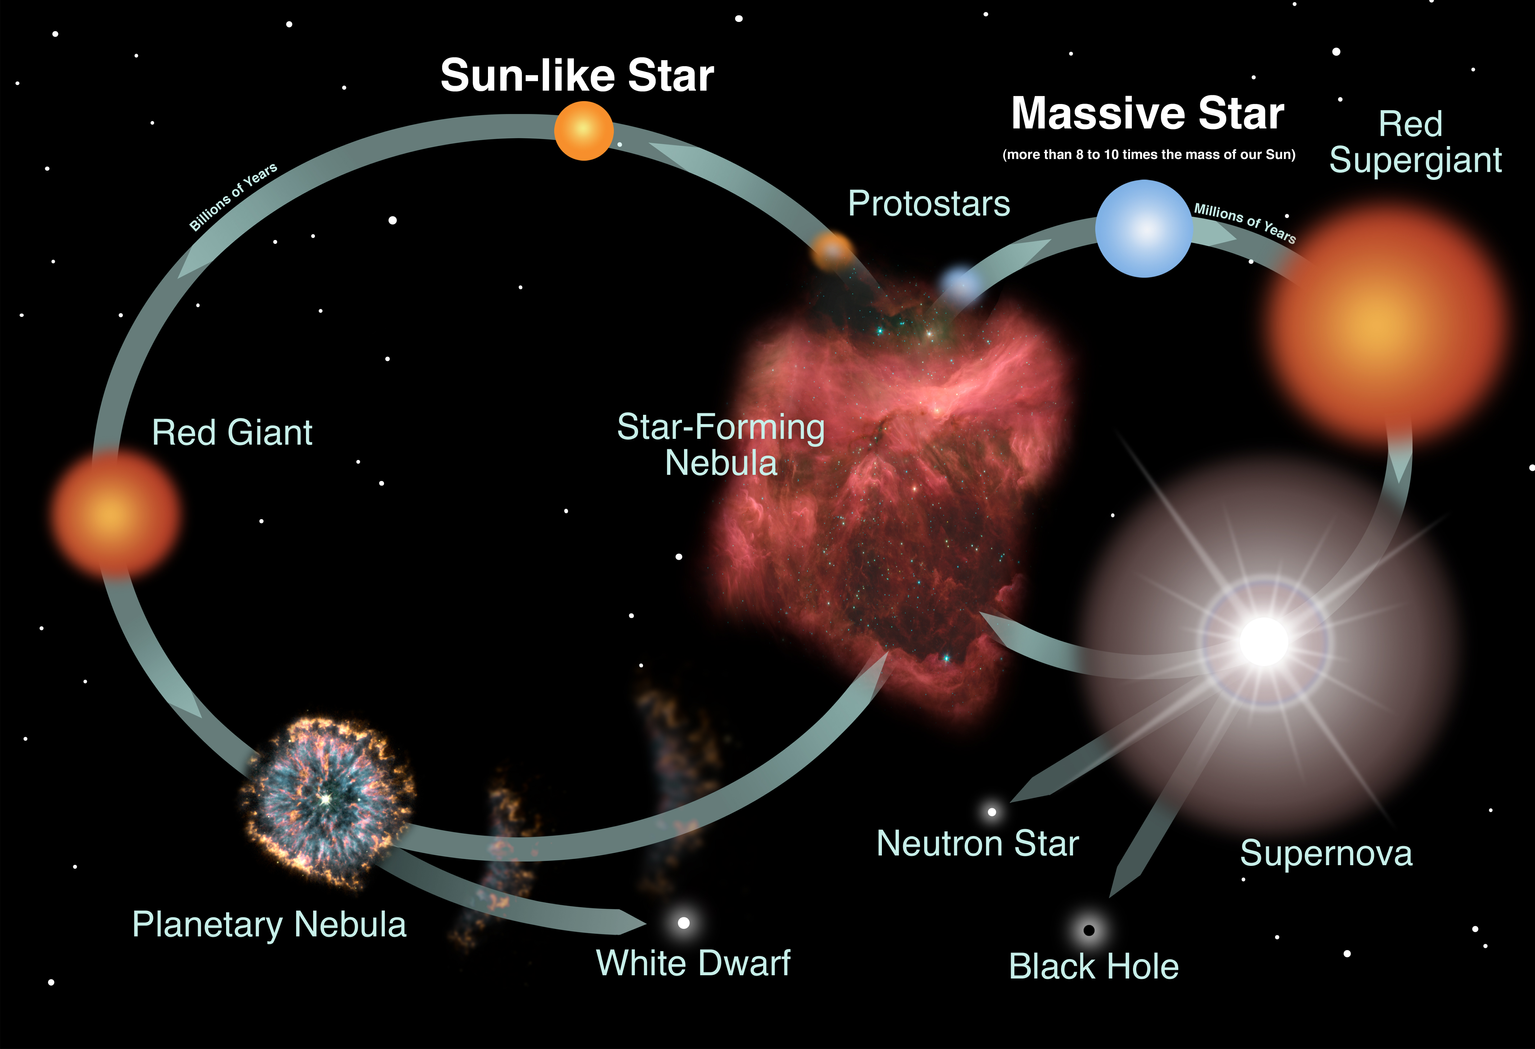
This infographic shows that stars are supported by a balance between gravity and internal pressure, and that their later evolution depends strongly on mass. It is useful for linking core fusion, stability, and the different end states of stars. Source
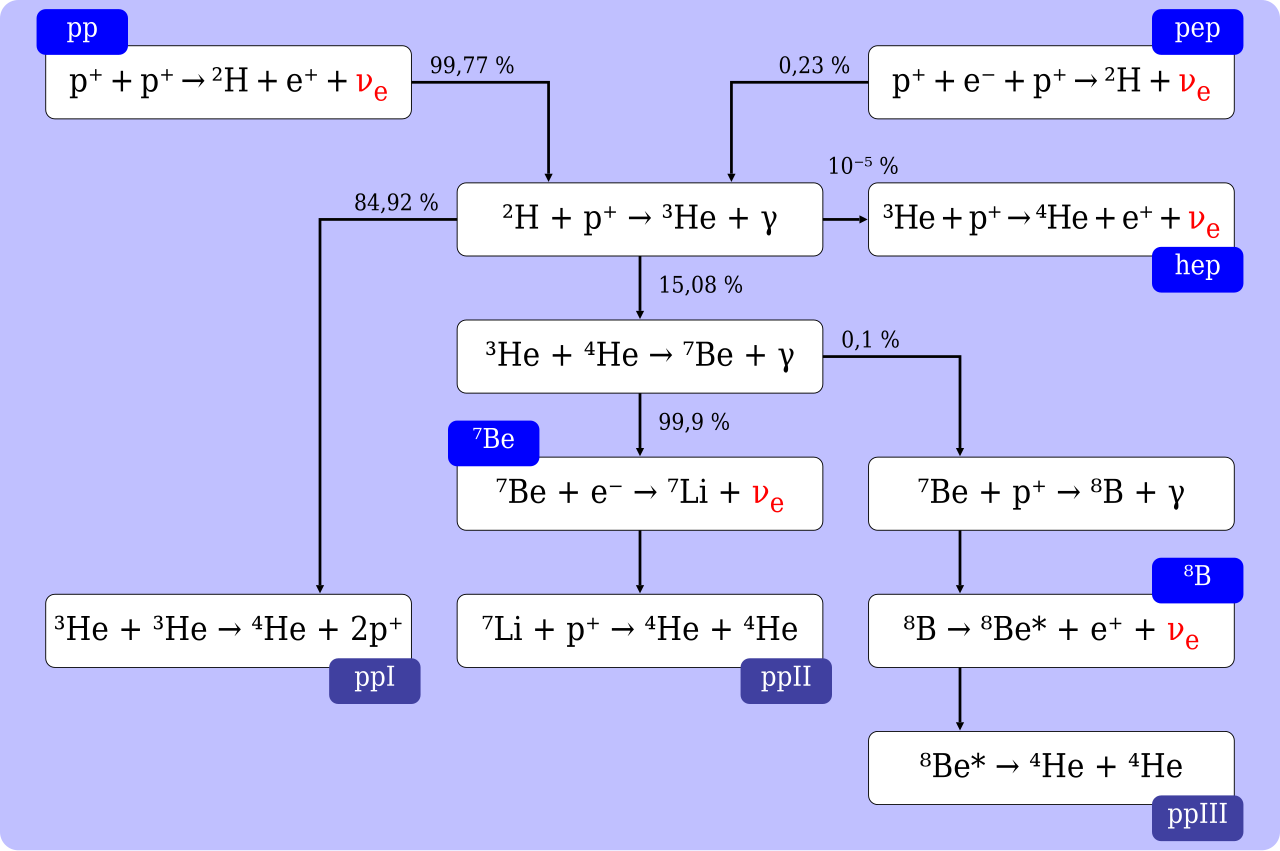
This diagram shows one key fusion pathway by which hydrogen is converted into helium inside stars like the Sun. It helps connect the idea of mass defect with the energy source that powers stellar radiation. Source
Stellar evolution and effect of mass
A star forms when a nebula/protostar contracts under gravity until the core becomes hot enough for fusion to ignite.
The main sequence is the long stable stage where a star spends most of its life fusing hydrogen.
A low-/medium-mass star evolves roughly as: protostar → main sequence → red giant → white dwarf.
A high-mass star evolves more rapidly and can end as: protostar → massive main sequence star → red supergiant/supergiant → supernova → neutron star or black hole.
Mass is the key factor determining a star’s temperature, luminosity, lifetime, and final fate.
Exam link: massive stars live shorter lives because they burn fuel at a much faster rate despite having more fuel.
Hertzsprung–Russell (HR) diagram
The HR diagram plots luminosity on the vertical axis against surface temperature on the horizontal axis.
The horizontal axis is used in the IB convention with temperature decreasing to the right.
You must recognize the main regions: main sequence, red giants, supergiants, white dwarfs, and the instability strip.
Main-sequence stars run diagonally from top left (hot, bright) to bottom right (cool, dim).
Red giants/supergiants are cool but very luminous, so they lie in the upper right.
White dwarfs are hot but dim, so they lie in the lower left.
Lines of constant radius can be drawn on the HR diagram; for a given luminosity, a cooler star must have a larger radius.
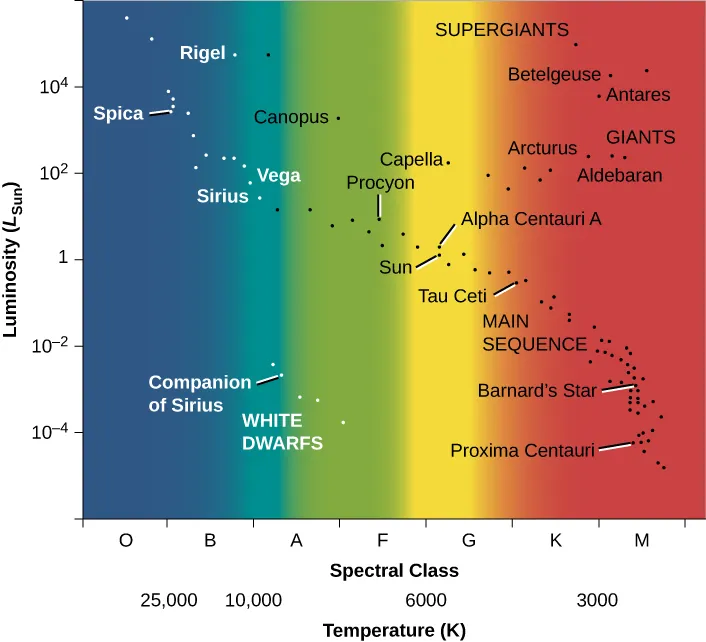
This diagram clearly labels the main sequence, giants, supergiants, and white dwarfs on an H–R diagram. It is ideal for learning the axis directions and the locations of the major stellar regions. Source
Distance, spectra and stellar radius
Stellar parallax is used to find the distance to nearby stars: .
A smaller parallax angle means a greater distance.
Required conversions: and ; also know AU, ly, and pc conversions where needed.
A star’s surface temperature can be estimated from its stellar spectrum or peak wavelength using Wien’s law: .
A star’s composition is identified from absorption/emission lines in its spectrum.
A star’s radius can be found from luminosity and surface temperature using black-body radiation: .
Useful relative form: .
Rearranging for radius: .
Exam traps and quick links
Do not confuse brightness with luminosity: luminosity is total power output of the star, while apparent brightness depends on distance.
On an HR diagram, remember the temperature axis is reversed: hotter stars are on the left.
A star can be cool but very luminous if it has a very large radius.
Fusion releases energy because the products have greater binding energy per nucleon and therefore lower total mass.
Parallax is reliable only for relatively nearby stars.
In data questions, use the star’s spectrum to infer temperature/composition, then combine with luminosity to infer radius or HR position.
Checklist: can you do this?
Explain why a star remains stable in terms of gravity and radiation/gas pressure.
Compare the life cycles of low-mass and high-mass stars.
Identify and interpret the main regions of an HR diagram, including constant-radius trends.
Calculate stellar distance from parallax and convert between AU, ly, and pc.
Determine a star’s radius from luminosity and surface temperature.