
OCR Specification focus:
‘Describe sampling and recording methods used to determine the distribution and abundance of organisms in varied ecosystems.’
Measuring the distribution and abundance of organisms helps ecologists understand species patterns, community structures, and ecosystem health, forming the basis for effective conservation and environmental management.
Sampling and Ecological Surveys
Field ecologists cannot count every organism in an ecosystem, so sampling is used to obtain representative data. Accurate sampling allows reliable conclusions about species distribution (where organisms occur) and abundance (how many organisms are present). Consistent methodology ensures results are repeatable, comparable, and scientifically valid.
Planning an Ecological Study
Before sampling begins, ecologists must:
Define the aims and hypotheses of the investigation.
Select a suitable study site representing the target ecosystem.
Decide on appropriate sampling techniques (random, systematic, or stratified).
Identify biotic and abiotic variables to record.
Ensure ethical practice and minimal disturbance to organisms.
Pilot studies are often carried out to refine methods and determine appropriate sampling effort.
Measuring Distribution
Random Sampling
Used when the area is homogeneous and free from obvious gradients.
A grid is overlaid on the area.
Random coordinates are generated, e.g., using a random number table.
Samples are taken at each coordinate point.
Random sampling avoids bias, ensuring every location has an equal chance of selection.
Systematic Sampling
Used when an environmental gradient is present (e.g., from shoreline to inland).
Samples are taken at regular intervals along a transect line.
This method is ideal for studying changes in species composition across conditions like light, moisture, or salinity gradients.
Stratified Sampling
Applied when the habitat contains distinct sub-habitats or zones.
The area is divided into strata based on characteristics (e.g., open grassland vs shaded woodland).
Samples are taken from each stratum proportionally to its area.
Stratified sampling improves accuracy when variation within the area is known.
Measuring Abundance
Abundance quantifies how many organisms of a species are found in a given area or volume. It can be measured in several ways depending on organism type and mobility.
Quadrat Sampling
Quadrats are square frames (commonly 0.25 m² to 1 m²) used to standardise sampling areas.
Suitable for plants and sessile animals such as barnacles.
Quadrats may be placed randomly, systematically, or along a transect.
Within each quadrat, ecologists record:
Species present (species richness).
Frequency (percentage of quadrats containing the species).
Percentage cover (estimated area occupied by the species).
Density (number of individuals per unit area).
Random sampling with frame quadrats allows ecologists to estimate frequency, percentage cover, and density for plants and other stationary organisms.
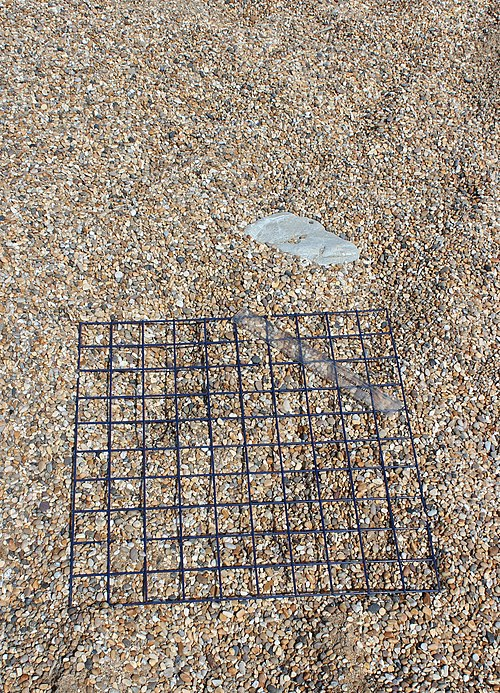
A portable frame quadrat placed on a natural substrate to demarcate a fixed sample area. Students record presence/absence, percentage cover, or counts of target species within the frame. Note that this example is used to size pebbles, which adds extra detail beyond the OCR focus. Source.
Density: The number of individuals of a species per unit area or volume of habitat.
Transects
Transects help study distribution patterns across gradients.
Line transect: record species touching or crossing a tape line.
Belt transect: record all species within a fixed-width strip along the line (e.g., 1 m).
Interrupted belt transect: samples taken at intervals for efficiency.
A line or belt transect is laid across an environmental gradient, with samples recorded at set distances or randomly located points to describe distribution changes.
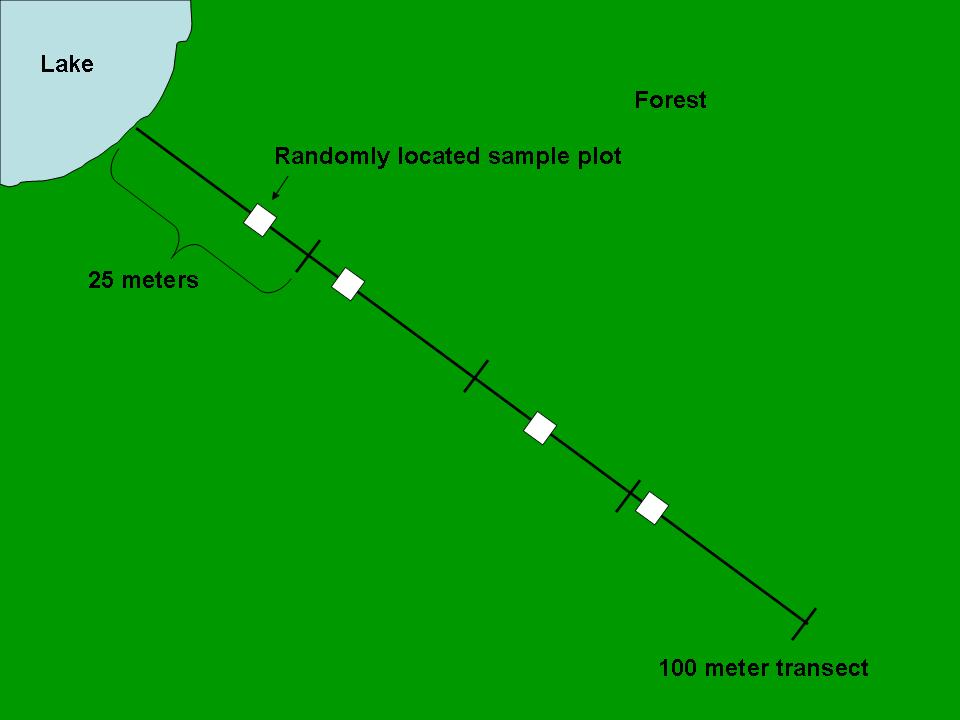
Diagram of a 100-m transect subdivided into sections with randomly located sample plots. This visual demonstrates how to place quadrats or plots along a line to capture changes in species distribution across a gradient. Labels are minimal and layout is uncluttered, matching OCR field sampling expectations. Source.
This method reveals how species composition and abundance vary with environmental change.
Mark–Release–Recapture
Used for mobile animals such as insects, birds, or mammals.
A sample of individuals is captured, marked harmlessly, and released.
After a suitable time, another sample is captured.
The proportion of marked individuals in the second sample is used to estimate total population size.
EQUATION
—-----------------------------------------------------------------
Lincoln Index (Population Size) = (Number in first sample × Number in second sample) ÷ Number of marked recaptures
Number in first sample = Individuals caught and marked initially (no units)
Number in second sample = Individuals caught in second sample (no units)
Number of marked recaptures = Individuals recaptured that were previously marked (no units)
—-----------------------------------------------------------------
Marking must not alter behaviour or survival, and sufficient time must elapse for mixing but not migration.
Recording and Analysing Data
Accurate recording ensures valid conclusions. Data are often recorded in species lists or abundance tables, noting time, date, weather, and habitat conditions. Quantitative data can be summarised using mean, mode, or range, and graphical presentation helps visualise patterns.
Frequency and Percentage Cover
Frequency: proportion of quadrats containing the species.
Percentage cover: estimated visual area covered by the species within a quadrat.
Useful when individual organisms cannot be easily counted, e.g., mosses.
Species Richness and Diversity
Species richness refers to the total number of different species present, while species diversity considers both richness and relative abundance.
Species diversity: A measure of the variety of species in a community, accounting for both the number of species and their relative abundance.
Diversity indices (such as Simpson’s Index) may be used to compare ecosystems or monitor changes over time.
Minimising Bias and Error
To maintain accuracy and reliability, ecologists:
Use sufficient sample size for representative data.
Apply randomisation where possible.
Standardise sampling equipment and methods.
Avoid double counting mobile organisms.
Conduct repeated sampling at different times and conditions.
Consistency across replicates increases confidence in population estimates.
Practical Considerations in Fieldwork
Time of year and weather influence species activity and visibility.
Habitat sensitivity requires careful handling to prevent long-term damage.
Identification keys and field guides ensure correct species identification.
Ethical standards must be followed, avoiding harm or unnecessary disturbance.
Modern studies may also employ technological tools, such as remote sensing, camera traps, and drone surveys, to enhance precision and coverage.
Ecological Interpretation
The combined data on distribution and abundance allow ecologists to interpret ecosystem structure, detect changes due to environmental factors, and assess the impact of human activity. Understanding these patterns is fundamental for conservation planning, habitat restoration, and sustainable management of ecosystems.
Practice Questions
Question 1 (2 marks)
Explain why random sampling using quadrats is important when estimating the abundance of plant species in a grassland ecosystem.
Mark scheme:
1 mark for stating that random sampling avoids bias in selecting sampling sites.
1 mark for stating that it ensures the results are representative of the whole area or population.
Question 2 (5 marks)
Describe and explain how a belt transect could be used to investigate changes in the distribution of plant species across a sand dune ecosystem.
Mark scheme:
1 mark for stating that a tape measure or transect line is laid from the shoreline inland (across the environmental gradient).
1 mark for describing that quadrats are placed continuously or at regular intervals along the line to record plant species.
1 mark for recording the abundance of each species (e.g. using percentage cover or frequency).
1 mark for explaining that environmental factors (e.g. soil moisture, light intensity) could also be measured at each interval to identify correlations.
1 mark for explaining that this method allows patterns of species distribution or succession to be analysed across the gradient.
FAQ
Quadrat size and number depend on the habitat type and the size and density of the organisms being studied.
For small plants or densely packed species (e.g. grassland), small quadrats such as 0.25 m² are sufficient.
For sparse vegetation or large plants (e.g. heathland), larger quadrats up to 1 m² are preferred.
A pilot study often determines the minimum number of quadrats needed to achieve reliable, repeatable data — generally when additional samples produce little change in the calculated mean or frequency.
Percentage cover estimates are subjective, as they rely on visual judgement. Variability arises from:
Overlapping species or uneven plant height.
Observer bias — differences between individuals estimating cover.
Environmental conditions such as poor visibility or dense vegetation.
To improve accuracy, ecologists may use gridded quadrats or digital image analysis to standardise measurement and reduce personal error.
Point quadrats are particularly useful in habitats with overlapping vegetation or where accurate vertical structure information is needed.
A point quadrat consists of a frame with evenly spaced holes through which pins are lowered. Each species touched by the pin is recorded.
Provides precise, quantitative data on species frequency.
Reduces bias in estimating percentage cover.
Useful in grasslands or heathlands where species layering complicates visual estimation.
Systematic sampling is chosen when an environmental gradient or zonation is expected, such as along a shore, hillside, or pollution gradient.
Sampling at regular intervals along a transect reveals how species composition and abundance change in relation to abiotic factors.
It provides structured data suitable for statistical correlation, though it may introduce bias if the chosen interval coincides with natural patterns — hence combining with randomised placement along the transect can improve reliability.
