
OCR Specification focus:
‘Use the HR diagram: luminosity–temperature plot showing main sequence, giants, and white dwarfs.’
The Hertzsprung–Russell (HR) diagram is a fundamental tool in astrophysics, allowing astronomers to compare stellar luminosities and temperatures while revealing clear evolutionary patterns that link structure, energy generation, and stellar age.
Hertzsprung–Russell Diagram: Purpose and Axes
The HR diagram is a plot that relates two measurable stellar properties: luminosity and surface temperature. It enables stars to be categorised into major groups and helps illustrate how stars evolve after leaving the main sequence.
Hertzsprung–Russell (H–R) diagram is a luminosity–temperature plot showing the main sequence, giants/supergiants, and white dwarfs.
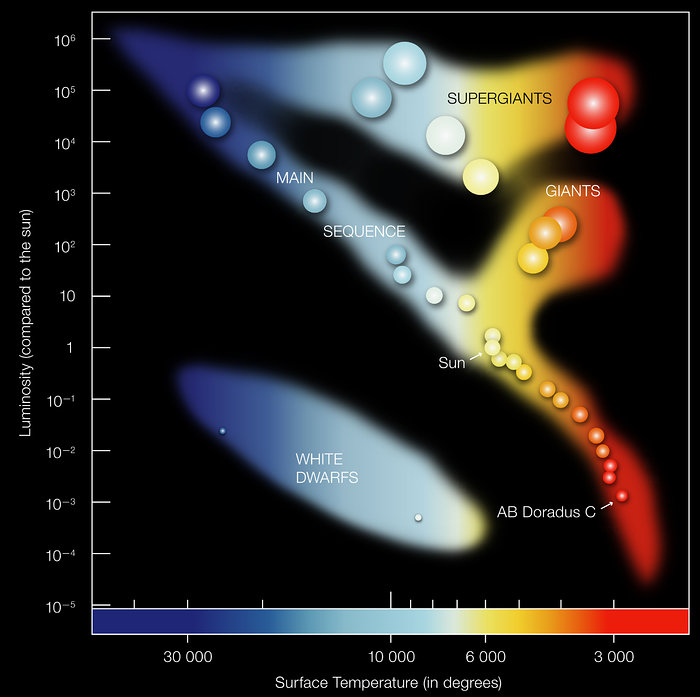
A schematic Hertzsprung–Russell diagram showing stellar luminosity versus temperature. The main sequence runs diagonally, with giant and supergiant regions above and white dwarfs below. Axes and regions are labelled at the level appropriate for OCR A-Level Physics. Source.
Luminosity: The total energy a star emits per second compared to the Sun, often expressed in multiples of solar luminosity (L☉).
After introducing luminosity, it is helpful to recognise that the HR diagram incorporates a temperature scale that is reversed compared to typical graphs.
Surface Temperature: The effective temperature of a star’s photosphere, usually measured in kelvin (K), decreasing from left to right on the HR diagram.
The axes are constructed as follows in standard HR diagrams used at A-Level:
Vertical axis: luminosity relative to the Sun, on a logarithmic scale
Horizontal axis: surface temperature, decreasing left to right; sometimes replaced by spectral class (O–B–A–F–G–K–M)
This arrangement creates a diagram where distinct stellar groupings emerge naturally from observational data.
The Main Stellar Regions on the HR Diagram
OCR requires students to recognise the position of the main sequence, giants, and white dwarfs. Each region corresponds to a particular structural and evolutionary state.
Main Sequence
The main sequence is the dominant diagonal band running from top left (hot and luminous) to bottom right (cool and dim). Almost all stars spend the majority of their lifetimes in this phase.
Main Sequence: The long-lasting stellar phase in which hydrogen fusion occurs in the core, providing hydrostatic equilibrium.
Between definition blocks, it is helpful to emphasise that stars appear on different parts of the main sequence because of mass differences, not age alone.
Key features of the main sequence include:
High-mass stars are located at the upper left, with very high temperatures and luminosities
Low-mass stars lie near the lower right, cooler and significantly less luminous
A star’s position reflects its mass, which determines fusion rate, lifespan, and internal structure
Giant and Supergiant Region
Above the main sequence lies the region of giants and supergiants, where stars become extremely luminous despite relatively modest surface temperatures. This occurs as stars expand significantly near the end of their hydrogen-fusion phase.
Giant Star: A luminous, large-radius star formed when hydrogen in the core is exhausted and fusion occurs in a shell surrounding the core.
This stage involves dramatic structural changes that cause the star to shift position on the HR diagram.
Typical characteristics of giant and supergiant stars:
Located in the upper right region of the HR diagram
High luminosity due to large surface area despite cooler surface temperatures
Represent an evolved state of both low-mass and high-mass stars, though their exact paths vary
White Dwarf Region
The white dwarf area is found at the lower left of the diagram and contains the dense, hot remnants of low-mass stellar evolution. They have extremely high temperatures but very low luminosities because of their small surface area.
White Dwarf: The compact stellar remnant supported by electron degeneracy pressure after a low-mass star has shed its outer layers.
White dwarfs gradually cool over time, moving downward on the HR diagram but remaining on the left because of their high initial temperatures.
How the HR Diagram Demonstrates Stellar Evolution
Though the OCR requirement focuses on using the diagram rather than providing full evolutionary pathways, the HR diagram visually summarises how stars transition between major stages. The diagram therefore allows students to interpret a star’s stage of life based on its temperature and luminosity.
By locating a star’s position on the H–R diagram, we can infer broad evolutionary class (main sequence, giant/supergiant, or white dwarf).
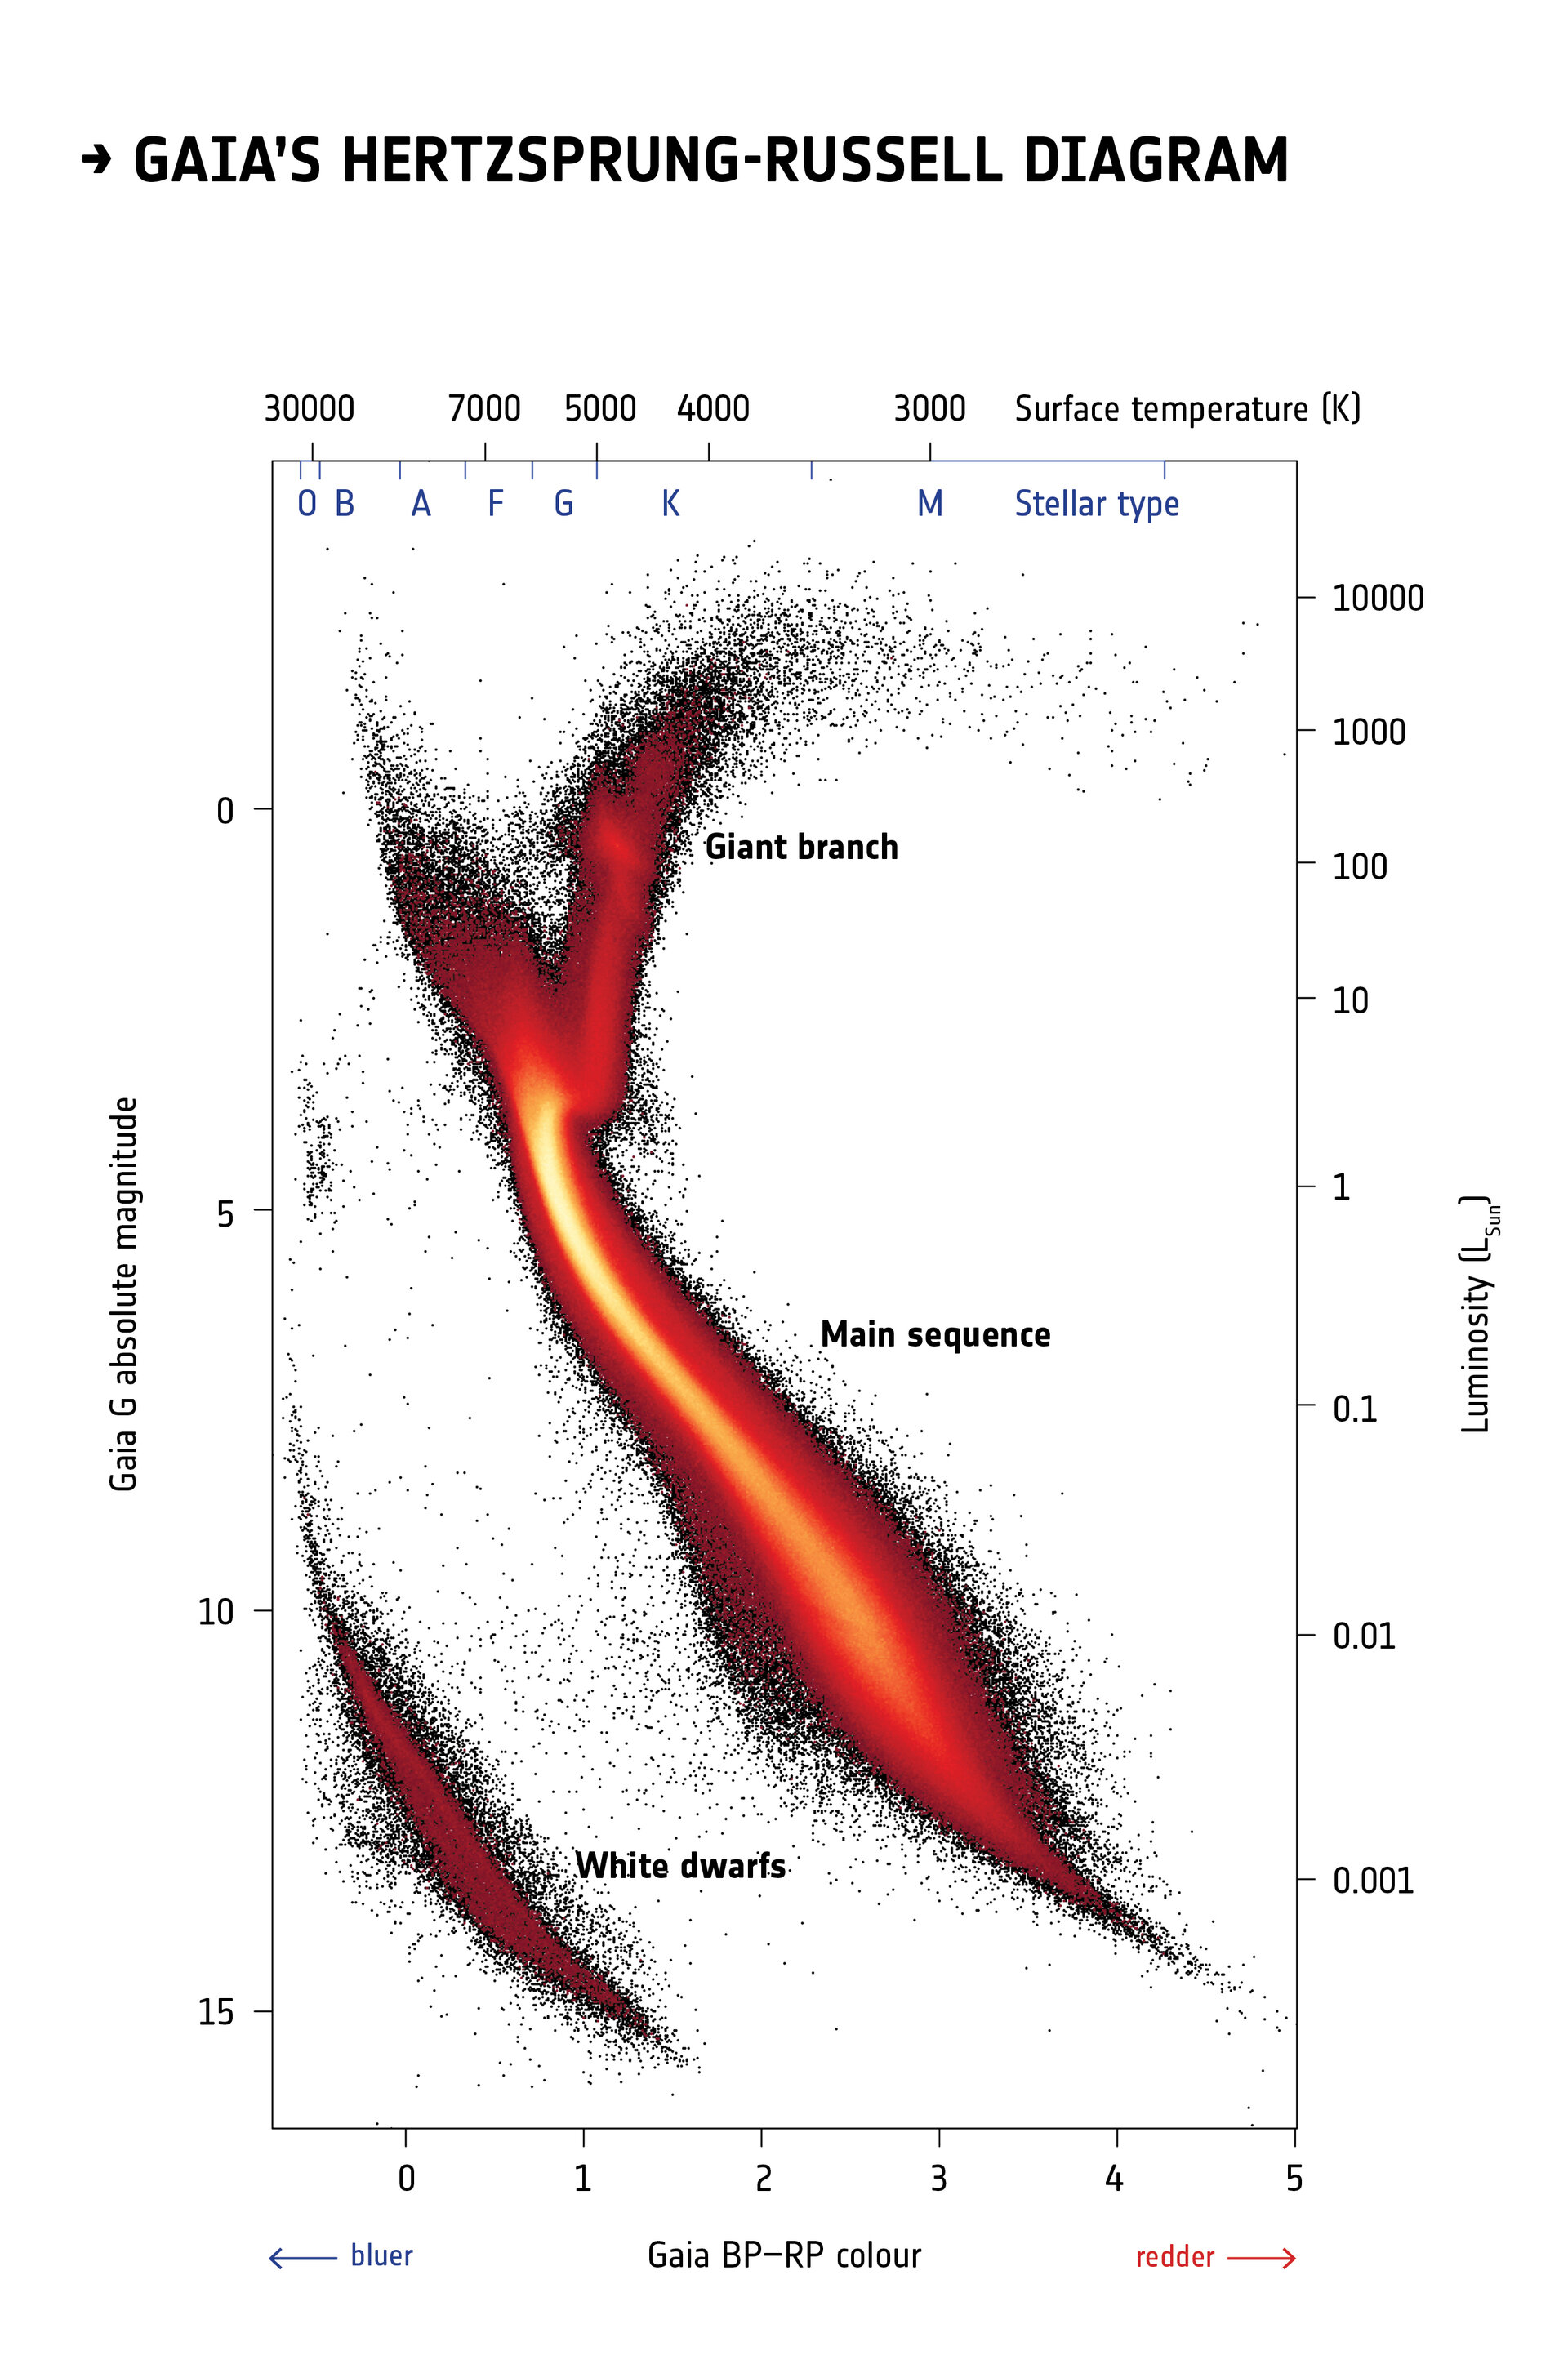
An observational Hertzsprung–Russell diagram from ESA’s Gaia mission, showing real stellar data. The main sequence, red-giant branch, and white-dwarf region appear as distinct features. Extra fine population structure is present but can be ignored at OCR A-Level. Source.
Stellar motions through the HR diagram typically follow these patterns:
Main sequence to giant: as hydrogen becomes depleted in the core, the core contracts and the outer layers expand
Giant to white dwarf (low-mass stars): outer layers are expelled, leaving a hot core
High-mass stars do not pass into the white dwarf region; instead, they explode as supernovae and form neutron stars or black holes, though these latter remnants are not plotted on traditional HR diagrams
These movements help illustrate how temperature and luminosity change with internal processes such as core contraction, expansion of the outer envelope, and changing fusion mechanisms.
Interpreting Stellar Properties Using the HR Diagram
The HR diagram allows students to infer key properties of a star, often without needing to perform detailed calculations. It is a powerful diagnostic tool across astrophysics.
Important interpretative uses include:
Determining approximate stellar radius, since large stars have high luminosity at lower temperatures
Estimating stellar age, as clusters show characteristic patterns depending on which stars have left the main sequence
Identifying stellar type, since main sequence, giant, and white dwarf regions are clearly separated
Understanding temperature-luminosity relationships, highlighted by the presence of both hot, dim stars (white dwarfs) and cool, bright stars (giants)
These insights make the HR diagram a central resource in modern astrophysics and an essential component of the OCR A-Level Physics course.
Practice Questions
Question 1 (2 marks)
The Hertzsprung–Russell (HR) diagram plots stars according to their luminosity and surface temperature.
State where white dwarfs are located on the HR diagram and explain why they appear in this region.
Question 1 (2 marks)
White dwarfs are found in the lower-left region of the HR diagram. (1)
They appear here because they have high surface temperatures but very low luminosities due to their small radii. (1)
Question 2 (4 marks)
A group of stars in a distant cluster are observed to form a clear diagonal band running from the upper left to the lower right of an HR diagram.
Describe what this band represents and explain why stars of different masses appear at different positions along it.
Question 2 (4 marks)
The diagonal band is the main sequence. (1)
Stars on the main sequence are fusing hydrogen in their cores. (1)
High-mass stars are located at the upper left because they are hotter and more luminous. (1)
Low-mass stars are located at the lower right because they are cooler and less luminous. (1)
FAQ
The slope of the main sequence reflects how luminosity depends strongly on mass: small increases in mass lead to disproportionately large increases in luminosity.
This is because the rate of hydrogen fusion in stellar cores rises steeply with central temperature and pressure, both of which increase with mass.
As a result, massive stars lie high on the main sequence because their fusion processes operate far more rapidly than in low-mass stars.
The HR diagram traditionally uses the astronomical convention of ordering stars by spectral class (O–B–A–F–G–K–M), which corresponds to decreasing temperature.
Because this classification is deeply embedded in observational astronomy, the temperature axis is reversed to match spectral order.
This design makes it easier for astronomers to compare diagrams, catalogues, and spectral data consistently.
White dwarfs retain the thermal energy of their former stellar cores after shedding their outer layers.
Their extremely small radii mean that, despite being very hot, they emit relatively little total energy.
Key points:
High temperature comes from residual heat.
Low luminosity results from tiny surface area and no ongoing fusion.
The star’s mass and internal composition govern how its temperature and luminosity change as core hydrogen becomes depleted.
For example:
Low-mass stars expand and cool significantly, moving toward the red-giant region.
More massive stars undergo stronger increases in luminosity during core contraction, producing steeper or more complex evolutionary tracks.
Metallicity (chemical composition) also influences opacity, subtly altering the trajectory.
Stellar properties vary smoothly with mass and composition, so the transitions between regions represent broad changes, not exact category lines.
Real stars also evolve continuously, crossing intermediate states that blur the edges of each region.
Additional factors that soften boundaries include:
Measurement uncertainties in luminosity and temperature
Effects of rotation, magnetic activity, and chemical variation
Binary interactions altering observed characteristics
