
OCR Specification focus:
‘Use electric field lines to represent magnitude and direction; map fields around charges.’
Electric field lines provide a visual and conceptual method for representing the strength, direction, and structure of electric fields, allowing students to interpret how charges interact in space.
Understanding Electric Field Lines
Electric field lines are a powerful representational tool used in physics to illustrate how electric fields produced by charges extend through the surrounding region. Because electric fields cannot be seen directly, lines provide a structured way of depicting both direction and magnitude, aligning exactly with the OCR requirement to represent magnitude and direction; map fields around charges.
When discussing field structure, it is essential first to understand what an electric field is: a region in which a charge experiences a force due to another charge. Electric field lines give this abstract idea a physical form that students can observe and interpret.
Electric Field Line: A conceptual line drawn such that its direction at any point gives the direction of the electric field, and its density indicates field magnitude.
Electric field lines allow us to build accurate qualitative models of how charges influence one another. Before exploring specific charge arrangements, it is important to recognise the standard conventions used across all diagrams, textbooks, and assessments.
Conventions for Electric Field Lines
Clear and consistent conventions ensure that electric field diagrams can be interpreted universally. To meet the specification’s requirement to “use electric field lines to represent magnitude and direction”, diagrams must follow these rules:
Lines start on positive charges and end on negative charges.
The direction of the field is away from positive charges and towards negative charges.
Lines never cross, because that would imply two possible field directions at a point.
The spacing between lines indicates field strength, with closer lines representing stronger fields.
Lines are drawn as smooth curves or straight paths depending on the charge configuration.
A uniform field is shown using parallel, evenly spaced lines.
These conventions form the foundation for all field-line mapping exercises.
Field Lines Around Single Charges
The simplest case is that of an isolated point charge. The arrangement of lines reveals both direction and how the field weakens with distance.
Positive Point Charge
Lines radiate uniformly outward.
Increasing separation between lines shows that the field decreases with distance.
The symmetry of the pattern reflects the spherical nature of the field.
Negative Point Charge
Lines point radially inward, converging on the charge.
Density changes with distance in the same way as for a positive charge.
Although these patterns look simple, they form the basis for understanding more complicated charge combinations.
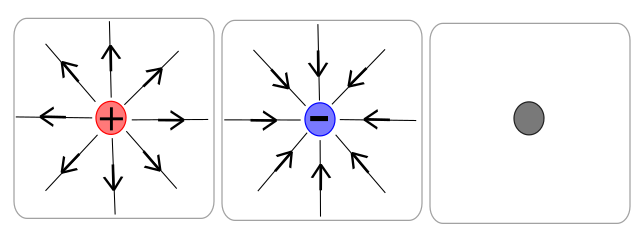
Electric field lines around a single positive charge point outward, while those of a negative charge point inward. The neutral object shows no field lines. Line density indicates stronger fields close to the charges. Source.
Field Lines Between Two Charges
When multiple charges are present, electric field lines demonstrate how the individual fields combine, providing crucial insight into the resulting net field.
Two Like Charges
For two positive or two negative charges:
Lines repel each other in the central region.
A neutral zone forms between the charges where the fields oppose one another.
Curvature of the lines indicates the direction of the net field at each point.
This demonstrates charge repulsion in a visual way that complements the physical force description.
Two Opposite Charges
With a positive and a negative charge:
Lines run from the positive charge to the negative charge.
The field pattern forms a characteristic dipole shape.
Lines are densest near the charges, highlighting large field magnitudes close to them.
Dipole fields are common in physics and form the basis for modelling molecules and other systems.
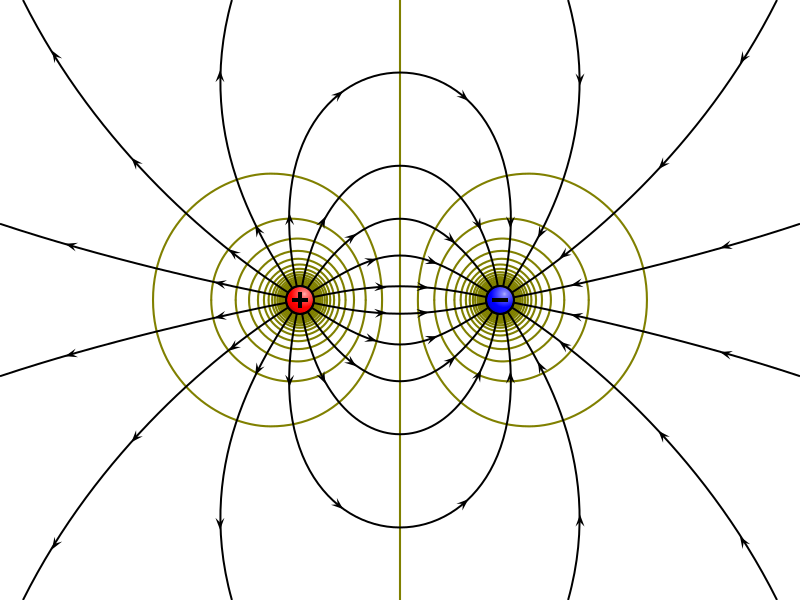
This image shows a dipole field with electric field lines running from the positive to the negative charge, along with equipotential lines perpendicular to them. The equipotential lines provide additional context for understanding experimental field mapping. Source.
Mapping Electric Fields Experimentally
The OCR specification requires students to be able to map fields around charges, and practical field-mapping techniques are central to achieving this.
Mapping typically uses the concept of equipotential lines, which are lines of equal electric potential. By locating these lines experimentally, students can infer the direction of the electric field because the field is always perpendicular to equipotential lines.
Common Method for Mapping Fields
A widely used approach involves conductive paper with electrodes attached. Students then measure potential differences across the paper to identify equipotential curves. From this procedure, the electric field lines can be inferred.
Steps include:
Placing electrodes in chosen positions (e.g., two point electrodes for a dipole).
Using a voltmeter probe to identify points of equal potential.
Marking multiple equipotential lines across the region.
Drawing electric field lines at right angles to these equipotentials.
This process reinforces the conceptual model and provides a bridge between theory and observation.
Interpreting Field Strength from Line Density
Electric field line density reveals how the magnitude of the field varies. Students must recognise that:
Higher density of lines corresponds to a stronger field.
Lower density corresponds to a weaker field.
Near a point charge, the field is strongest because the lines are closest together.
In uniform fields (such as between parallel plates), equal line spacing shows constant field strength.
This visual representation supports later topics such as uniform fields, electric potential, and motion of charged particles.
Three-Dimensional Nature of Field Patterns
Although field diagrams are typically drawn on a two-dimensional page, electric fields exist in three dimensions. For a spherical charge, for example, the lines radiate outwards in every direction. Students should mentally translate 2D diagrams into 3D patterns to deepen their physical intuition.
Practice Questions
(2 marks)
Describe how electric field lines indicate both the direction and the relative magnitude of an electric field around a charged object.
Question 1 (2 marks)
• Electric field lines show the direction of the field by pointing away from positive charges and towards negative charges. (1 mark)
• The relative magnitude of the field is shown by the spacing of the lines, with closer spacing indicating a stronger field. (1 mark)
(5 marks)
A student maps equipotential lines around two opposite point charges using conductive paper and a voltmeter.
Explain how the student can use the equipotential lines to draw the electric field lines, and describe the characteristic features of the field pattern expected for this charge arrangement.
Question 2 (5 marks)
• Electric field lines are drawn perpendicular to equipotential lines. (1 mark)
• Field lines should run from the positive charge to the negative charge. (1 mark)
• The pattern should show a dipole shape with curved lines. (1 mark)
• Line density should be highest close to each charge, showing stronger fields near the charges. (1 mark)
• No field lines should cross, and the student should ensure a symmetrical pattern around the line joining the charges. (1 mark)
FAQ
Electric field lines and lines of force refer to the same conceptual idea, but the emphasis differs slightly.
Electric field lines represent the direction and pattern of the field, whereas lines of force highlight the path a small positive test charge would follow if placed in that field.
In A-Level contexts, the terms are effectively interchangeable, but “electric field lines” is preferred when discussing diagrams and field structure.
Electric field lines begin on positive charges and end on negative charges, meaning they always have defined start and end points.
They cannot form closed loops because that would imply a charge influences itself without any external cause.
Additionally, closed loops would violate the fact that electrostatic fields are conservative, meaning the work done around a closed path must be zero.
Curved lines indicate that the direction of the electric field changes from point to point. This typically occurs when multiple charges are present.
The curvature shows the resultant field direction when individual fields combine.
Students should interpret curvature as demonstrating how a test charge would experience a continuously changing force as it moves within the field.
Symmetry allows you to predict how field lines must be arranged without detailed calculations.
For example:
• A single point charge has spherical symmetry, so lines spread evenly in all directions.
• Two identical charges produce mirror symmetry about the midpoint, ensuring lines repel symmetrically.
• A dipole has rotational symmetry about the axis joining the charges, guiding the shape of curved field lines.
Field line diagrams are symbolic rather than literal representations. Only a manageable number of lines can be drawn, so diagrams prioritise clarity over quantity.
Students should focus on relative line spacing, not the total number of lines.
• Closer spacing implies a stronger field.
• Even spacing suggests a uniform field.
The actual number of lines drawn has no physical meaning; the density pattern is what conveys field strength.
