
AP Syllabus focus:
‘Estimate one-sided limits from a table by examining function values for x approaching the target point only from the left or only from the right, and describing observed behavior.’
One-sided limits from tables allow students to observe directional behaviors of functions using numerical data, reinforcing how limits describe approach rather than exact function values at a point.
Understanding One-Sided Limits from Tables
A one-sided limit describes the value a function approaches as the input moves toward a specified point from only one direction—either from the left or from the right. Tables of values provide a structured numerical view of this behavior by listing inputs ever closer to a number, showing how outputs respond. Because numerical patterns often reveal trends that graphs can obscure, tables are a powerful tool for identifying directional tendencies in function behavior.
One-Sided Limit: The value a function approaches as the input approaches a specific point from only one direction—either the left or the right.
This perspective emphasizes how limits model behavior near a point rather than at the point itself, making tables particularly useful when a function is undefined, discontinuous, or complex near the value of interest.
Reading Tables for Left-Hand Limits
A left-hand limit, written as limₓ→c⁻ f(x), focuses on values of x that approach c from smaller numbers. Tables supporting left-hand limits present x-values progressively closer to c while remaining less than c.
Key features to examine include:
Whether the function values appear to stabilize near a single number.
Whether the values show consistent directionality as x approaches c.
Whether oscillation, divergence, or inconsistency suggests the limit does not exist.
What to Look For in Left-Hand Tables
Students should track numerical trends carefully:
Do the y-values approach a single finite number?
Do they grow without bound, indicating unbounded behavior from the left?
Do they fluctuate among multiple values, suggesting no one-sided limit exists?
Any clear and consistent approach toward a single number supports the existence of the left-hand limit.
Separate tables for the left-hand and right-hand sides help you see whether the function is approaching the same y-value from both directions or two different values.
Reading Tables for Right-Hand Limits
A right-hand limit, written as limₓ→c⁺ f(x), examines the behavior of f(x) for x-values greater than c that move closer to c. Tables for right-hand limits mirror left-hand tables but use descending values greater than c.
Interpreting Right-Hand Numerical Behavior
When reviewing a right-hand table, students should focus on patterns such as:
Values tending toward a shared finite number.
Rapid growth or decay indicating infinite or undefined tendencies.
Inconsistency or oscillation suggesting that a right-hand limit may not exist.
These observations allow students to compare right-hand and left-hand behaviors, which is essential for determining two-sided limits, although the present subsubtopic focuses solely on one-sided analysis.
Why Tables Are Effective for One-Sided Limits
Tables highlight how a function behaves locally, especially when algebraic simplification is difficult or when the function’s rule is unknown. They are particularly helpful:
Near points of discontinuity, where values may “jump” from one side to the other.
When functions are defined piecewise and directional behavior differs by interval.
When students must rely on numerical evidence rather than symbolic manipulation.
By narrowing attention to one direction, tables make directional trends visible and measurable, and they help students articulate limit behavior verbally and symbolically.
Common Observations in One-Sided Numerical Trends
When studying tables constructed for values approaching a point from only one side, certain recurring patterns emerge:
1. Approaching a Finite Number
If values draw nearer to a single real number, the one-sided limit exists and equals that number.
Students should note whether:
The values converge smoothly.
The values overshoot but continue tightening around the same number.
2. Divergence or Unbounded Growth
In some cases, function values increase or decrease without bound from one side.
Important characteristics include:
Rapid increases suggesting a vertical asymptote from that side.
Decreases toward large negative magnitudes.
Persistent directional growth rather than oscillation.
3. Oscillation
Oscillation occurs when values swing between two or more values without settling.
Students should check for:
Lack of convergence toward any single number.
Repeated fluctuations as x values approach c.
This behavior indicates that the one-sided limit does not exist.
How to Systematically Evaluate One-Sided Limits Using Tables
A structured procedure helps ensure consistent interpretation:
Identify from which direction x-values are approaching the target point.
Review the pattern of f(x) values in order from the x-values farthest to closest to c.
Ask whether values appear to approach a single number.
Interpret stabilization, divergence, or oscillation using the terminology of one-sided limits.
State the one-sided limit symbolically using correct limit notation.
If no single value is approached, decide whether the behavior suggests nonexistence or infinite behavior.
A one-sided limit table therefore uses x-values that march steadily toward the target number from only one direction, while the f(x)-values reveal what single number the function appears to be approaching.
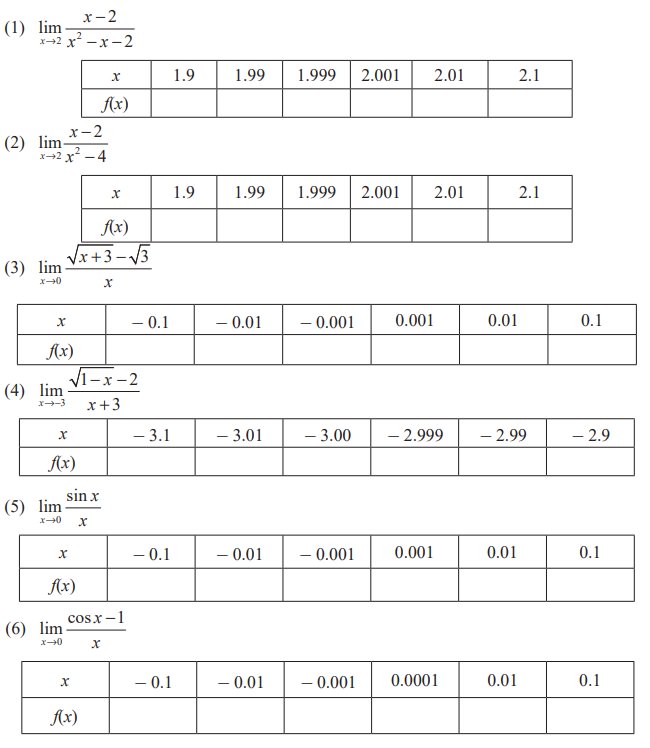
Collection of tables demonstrating how numerical values approach a target number from one or both sides. Each table highlights the pattern used to estimate limits, supporting the method described in the notes. Some tables include functions beyond this subsubtopic, but all reinforce the same table-based strategy. Source.
Recognizing directional behavior strengthens conceptual understanding of limits and prepares students for more advanced limit evaluation techniques.
Expressing One-Sided Limits in Words and Notation
Students should always connect numerical trends to formal mathematical language by describing:
The direction of approach.
The observed behavior of function values.
The final limit conclusion.
When the left-hand and right-hand one-sided limits suggested by the tables agree, we treat that common number as the limit of the function at that point.
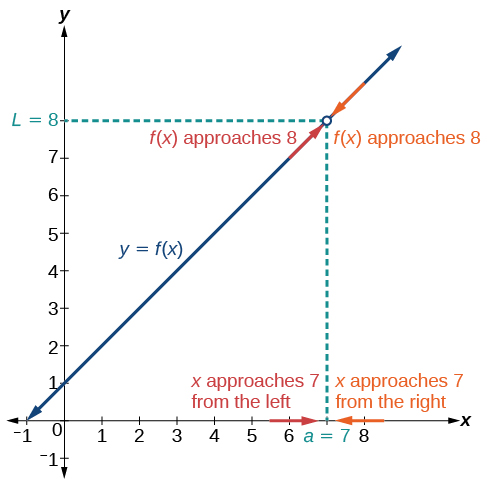
Graph showing a function approaching the same value L from the left and the right as x approaches a. The alignment of both one-sided limits illustrates how agreement in table values indicates a well-defined two-sided limit. The figure supports the conceptual link between numerical and graphical representations. Source.
Correct symbolic notation links these observations clearly to the concept of a limit and communicates the result precisely, reinforcing why one-sided analysis is essential when left-hand and right-hand behaviors differ.
Practice Questions
Question1 (1–3 marks)
A function f is evaluated at x-values approaching 4 from the right, giving the table below:
x: 4.5, 4.2, 4.1, 4.01
f(x): 3.1, 3.05, 3.02, 3.001
Use the table to estimate the one-sided limit of f(x) as x approaches 4 from the right.
State your answer and briefly justify it using the trend in the table.
Question1
• 1 mark: Correctly states that the one-sided limit is approximately 3.
• 1 mark: Observes that f(x) values decrease towards 3 as x approaches 4 from the right.
• 1 mark: Clear justification describing the numerical trend (e.g., values get closer to 3).
Question 2 (4–6 marks)
A function g is evaluated near x = -2, producing the following table:
x (approaching from the left): -2.5, -2.2, -2.1
g(x): 5.0, 4.4, 4.2
x (approaching from the right): -1.5, -1.9, -1.99
g(x): 3.0, 3.8, 3.95
(a) Estimate the left-hand limit of g(x) as x approaches -2.
(b) Estimate the right-hand limit of g(x) as x approaches -2.
(c) Decide whether the two-sided limit of g(x) exists at x = -2, giving a reason based on your answers.
Question 2
(a)
• 1 mark: Correctly estimates the left-hand limit as approximately 4.
• 1 mark: Justifies using the fact that g(x) values approach 4 from above as x approaches -2 from the left.
(b)
• 1 mark: Correctly estimates the right-hand limit as approximately 4.
• 1 mark: Justifies using the fact that g(x) values approach 4 from below as x approaches -2 from the right.
(c)
• 1 mark: Concludes that the two-sided limit exists.
• 1 mark: Correct reasoning: both one-sided limits approach the same value (approximately 4).
FAQ
Use values that get progressively closer to the target point while remaining strictly on one side. The precision depends on how quickly the function changes near that point.
Choose values that:
• halve the distance to the target each step, or
• change by a consistent shrinking increment.
Overly precise numbers (many decimal places) rarely add insight; consistency matters more than extremity.
First confirm that all x-values truly lie on the intended side of the point; mixing sides can create misleading patterns.
Erratic values may occur if:
• the function oscillates near the point
• rounding or calculator limitations distort sensitive values
• the function is undefined at intermediate points
If erratic behaviour persists, the one-sided limit likely does not exist.
Yes. One-sided limits describe how the function behaves as x approaches the point, not the function’s value at the point itself.
A missing function value, a hole, or even a vertical jump does not affect the existence of a one-sided limit. Only the directional trend of nearby values matters.
Check whether the function values grow in magnitude without bound while maintaining a consistent sign.
Look for:
• consistently increasing positive values (towards positive infinity)
• consistently decreasing negative values (towards negative infinity)
The table need not show extremely large numbers; the upward or downward trend alone is sufficient evidence.
Graphs may visually smooth out sharp transitions or rapid changes, especially when the scale is wide.
Tables capture behaviour at a finer resolution, revealing distinctions such as:
• subtle directional differences
• hidden jumps or sharp turns
• early signs of divergence
Thus, tables can uncover nuances that graphs may conceal due to scaling limitations.
