
AP Syllabus focus:
‘Maps can show absolute and relative distance and direction, clustering and dispersal patterns, and elevation differences.’
Spatial patterns on maps help geographers interpret how phenomena are arranged, connected, and distributed across Earth’s surface, revealing meaningful relationships and geographic processes.
Understanding Spatial Patterns on Maps
Spatial patterns describe how objects or phenomena are arranged across space. These patterns help geographers analyze human and environmental processes, identify trends, and understand how distance, direction, and distribution influence interactions among places.
Absolute Distance and Direction
Absolute distance describes the exact, measurable space between two locations using standard units such as miles or kilometers. Absolute direction refers to fixed compass directions like north, south, east, and west.
Absolute Distance: The measurable space between two places expressed using standard units (e.g., miles, kilometers).
Absolute measures provide consistency across maps, allowing comparisons of movement, accessibility, and spatial relationships. They form the basis of many geographic representations, especially in reference maps, where navigational accuracy is essential.
Relative Distance and Direction
While absolute measures focus on precision, relative distance and relative direction emphasize perception, connectivity, and context. These perspectives describe how far or in what direction something feels or functions relative to other places.
Relative Distance: A measure of connectivity or perceived space between places, often expressed in time, cost, or effort rather than physical units.
Relative measures shift when transportation, technology, or social factors alter the experience of moving between locations. They reflect how people interpret and navigate space in everyday life, making them crucial for understanding accessibility and interactions.
A map showing commuter travel time, for example, may present a very different pattern than one showing physical miles, revealing how distance can expand or contract based on human activity.
Clustering and Dispersal
Spatial distribution patterns provide essential information about how features or phenomena are arranged. Clustering indicates that objects are grouped tightly together, while dispersal shows that objects are spread out across a larger area.
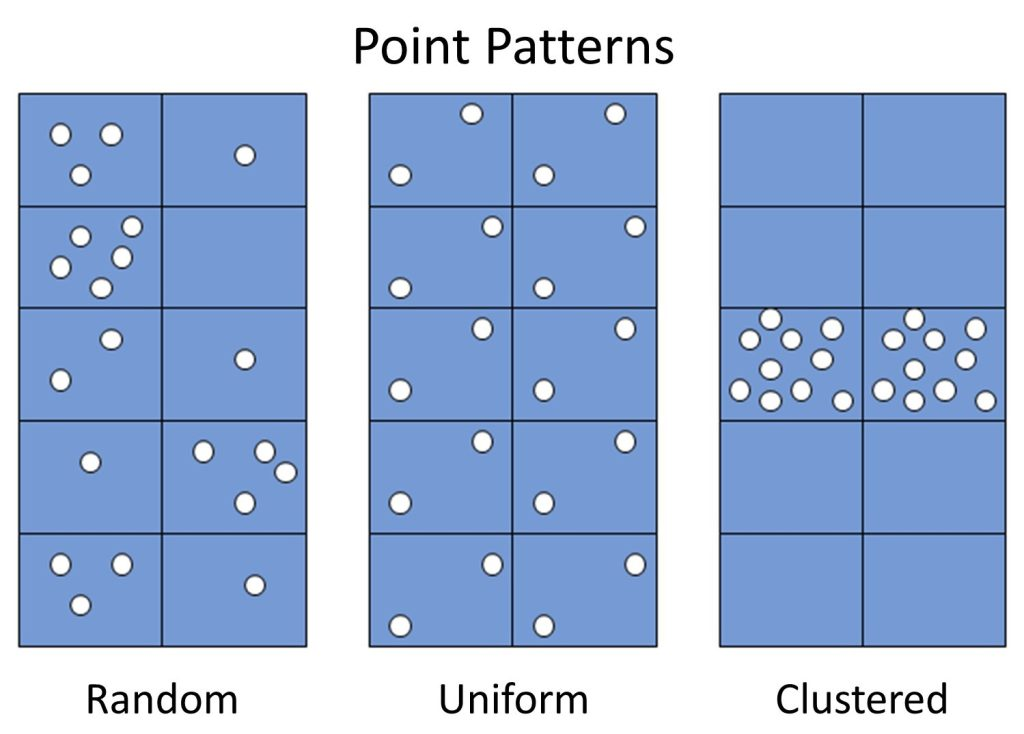
This diagram compares random, uniform, and clustered point patterns, showing how the same number of features can occupy space in different spatial arrangements. It reinforces the distinction between dispersed, evenly spaced features and tightly grouped clusters. The “uniform” category adds slightly more detail than the syllabus requires but strengthens understanding of spatial pattern differences. Source.
Clustering: A spatial pattern in which features are grouped closely together, forming concentrated areas.
Dispersal: A spatial pattern in which features are spread out evenly or irregularly over an area.
These patterns help identify processes such as urban growth, agricultural practices, disease spread, and demographic trends.
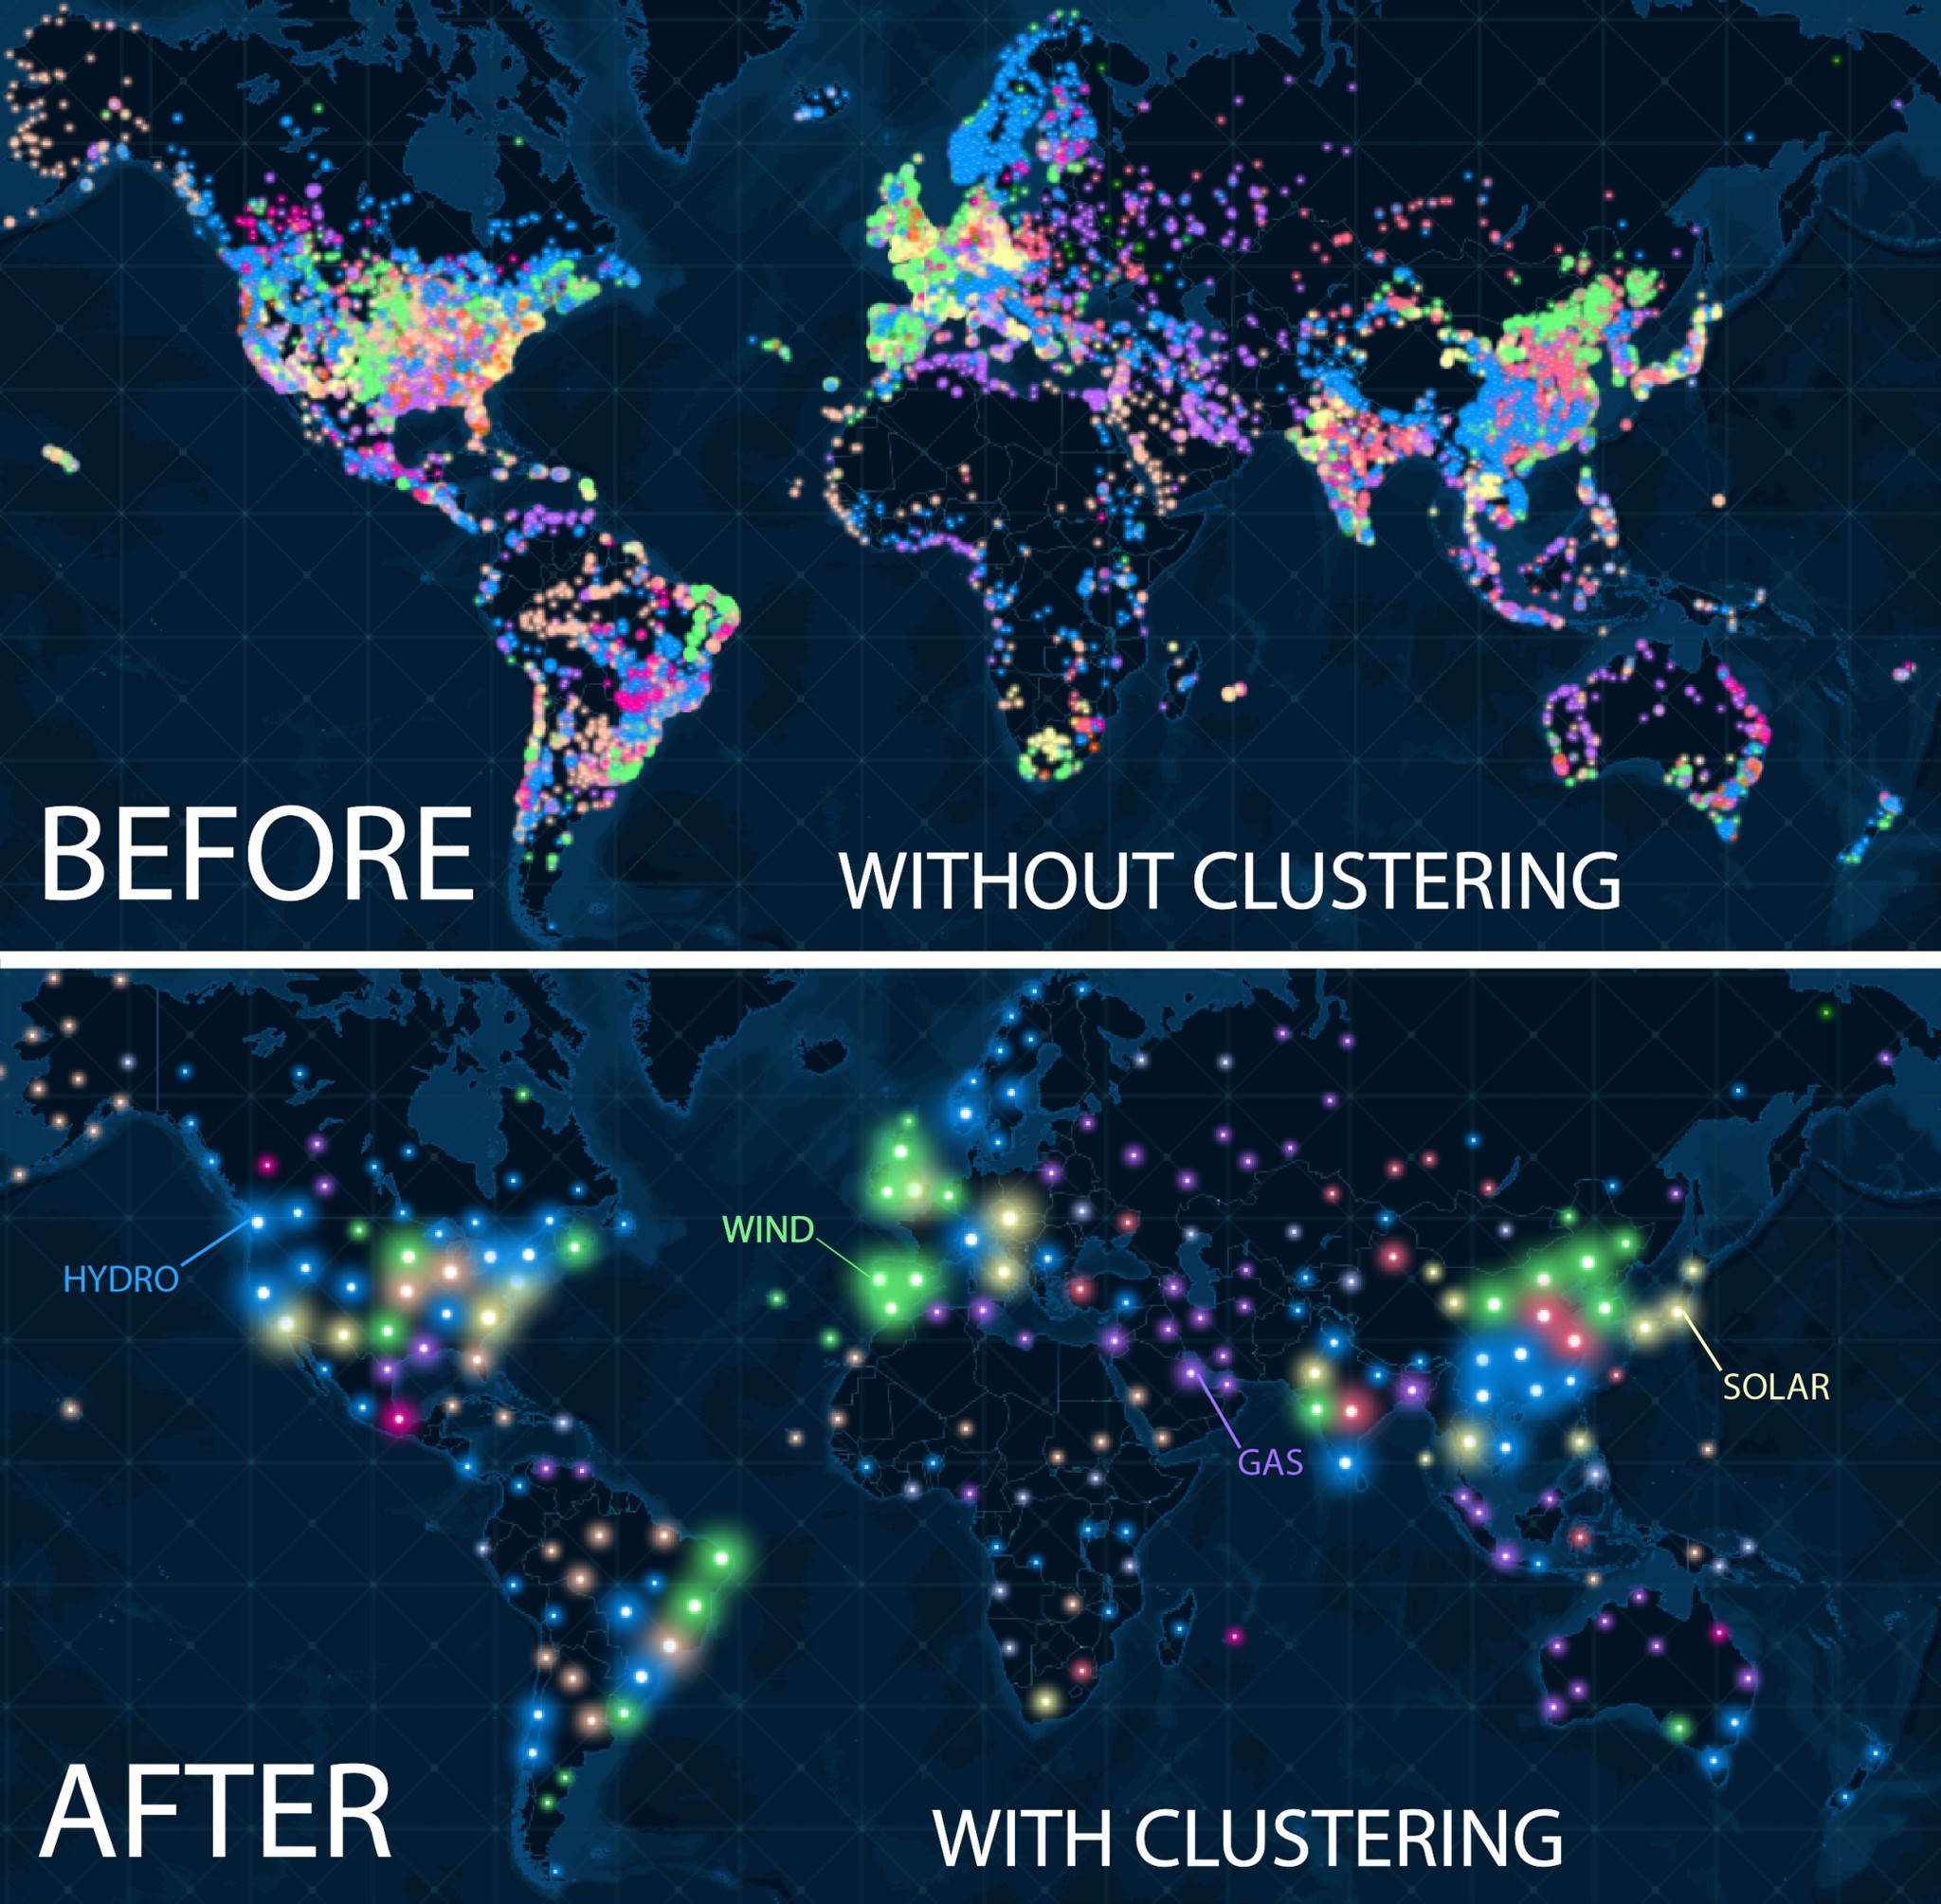
This pair of world maps demonstrates how individual point features can be aggregated into clusters to reveal clearer spatial patterns. The “before” map shows overlapping points, while the “after” map highlights regional concentrations more effectively. Although the dataset involves global power plants, the visualization directly supports understanding how clustering clarifies spatial distributions. Source.
Linear, Radial, and Random Patterns
Maps often reveal linear, radial, or random patterns, each associated with specific geographic processes.
Linear patterns follow straight or gently curving lines, often aligned with transportation corridors or environmental features.
Radial patterns spread outward from a central point, such as migration from an urban core or flows around a transportation hub.
Random patterns have no clear order or predictable arrangement, often signaling natural variation or decentralized decision-making.
These configurations allow geographers to infer underlying forces shaping space, such as planning decisions, environmental barriers, or market behavior.
Elevation and Topographic Relationships
Maps that depict elevation differences help geographers understand the third dimension of space. Elevation influences climate, settlement, agriculture, and transportation. Topographic maps use contour lines or shading to show variations in height, revealing slopes, valleys, and landforms.
Elevation: The height of a point on Earth’s surface above sea level, used to depict vertical variation in landscapes.
Elevation patterns reveal constraints and opportunities within a region. Closely spaced contour lines indicate steep slopes, while widely spaced lines signal flat terrain. These spatial relationships help explain patterns such as river flow, population density, and land-use strategies.
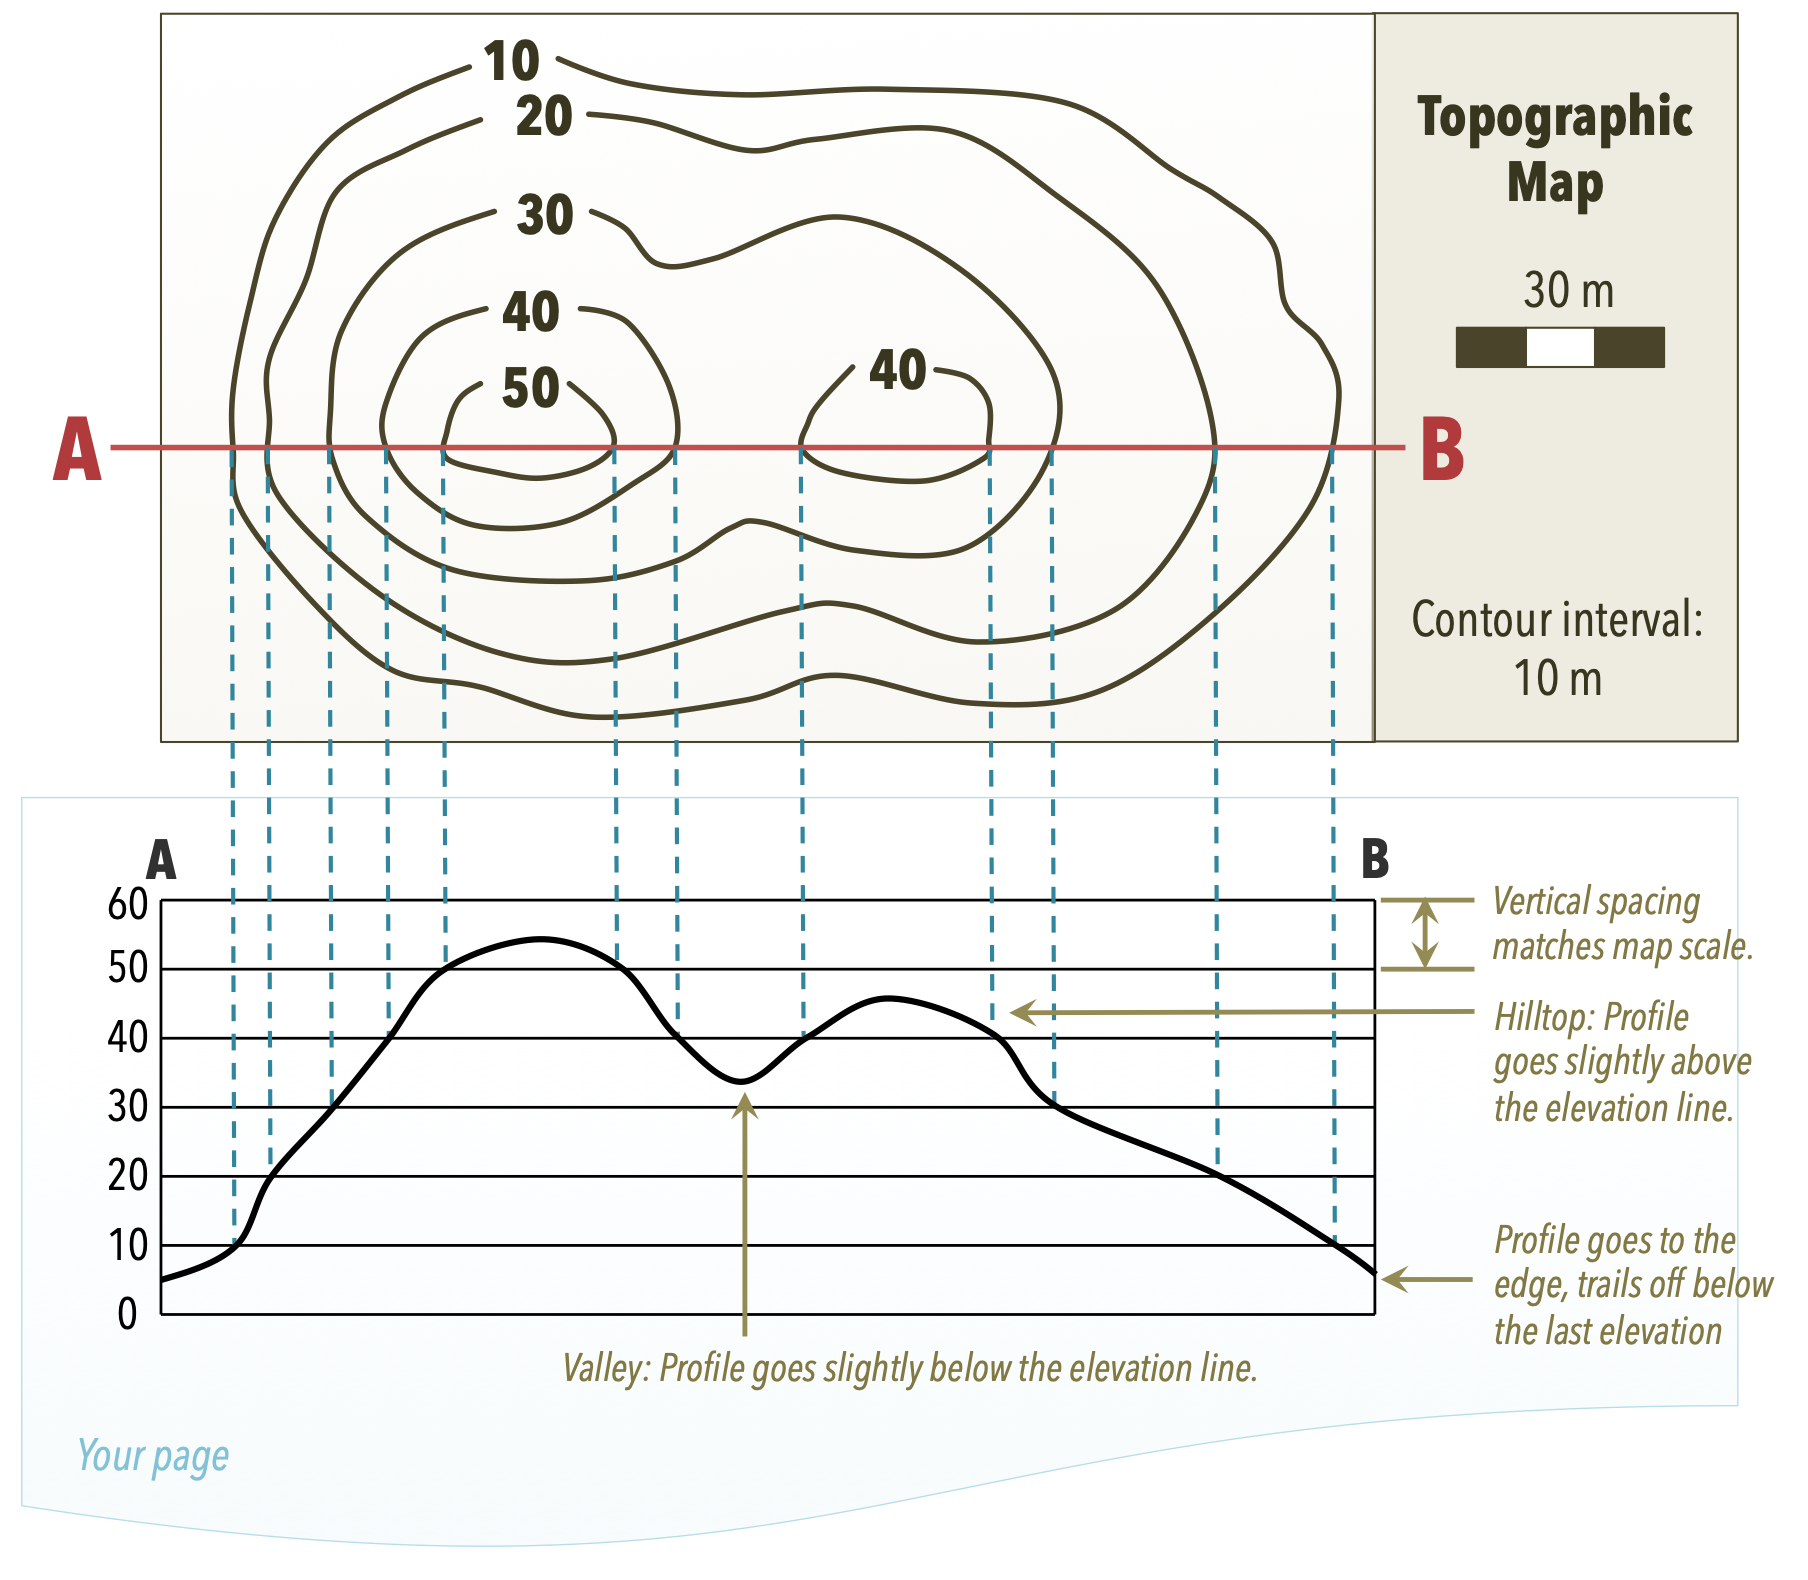
This figure pairs a simple contour map with a corresponding elevation profile, illustrating how vertical relief is represented in both map view and cross-section. It shows how steep slopes correspond to tightly spaced contour lines and flat terrain to widely spaced lines. The labeled contour intervals offer slightly more detail than required but remain directly relevant to understanding elevation differences. Source.
Spatial Relationships and Geographic Interpretation
Spatial relationships describe how places or features interact or connect with one another. Maps reveal relationships that shape human and environmental processes, including:
Proximity between features, influencing interaction likelihood.
Orientation of features, affecting movement routes and connectivity.
Distribution patterns, shaping cultural, economic, and environmental dynamics.
Interpreting these relationships allows geographers to understand how distance, direction, environment, and human systems influence decision-making and spatial outcomes.
Pattern Recognition Across Map Types
Different map types highlight different spatial patterns:
Reference maps display accurate locations and physical features, helping users observe distance, direction, and spatial arrangements.
Thematic maps emphasize patterns of data—population, climate, economic activity—that reveal clustering, variation, and trends.
Recognizing spatial patterns across map types enables geographers to link visual information with geographic concepts, making maps powerful tools for analysis and reasoning.
Why Spatial Patterns Matter
Understanding spatial patterns and relationships supports deeper geographic inquiry. Patterns on maps can indicate diffusion processes, inequalities, environmental risks, or cultural trends. By examining distance, direction, clustering, dispersal, and elevation, students can interpret how space shapes human behavior and Earth’s physical systems.
These patterns are foundational to geographic thinking and essential for analyzing interactions between places, scales, and processes.
Practice Questions
Question 1 (2 marks)
Explain the difference between absolute distance and relative distance as used in geographic analysis.
Mark scheme:
1 mark for defining or describing absolute distance as a measurable, standardised unit (e.g., miles or kilometres).
1 mark for defining or describing relative distance as perceived or functional distance (e.g., time, cost, or effort), or for clearly contrasting it with absolute distance.
Question 2 (5 marks)
Using examples, analyse how spatial patterns such as clustering and dispersal help geographers interpret human or environmental processes.
Mark scheme:
1 mark for defining clustering or describing it as features grouped closely together.
1 mark for defining dispersal or describing it as features spread out across an area.
1 mark for explaining how clustering can indicate a process (e.g., economic concentration, disease hotspots, population density patterns).
1 mark for explaining how dispersal can reveal limiting factors, environmental constraints, or land-use practices.
1 mark for providing at least one relevant example tied explicitly to clustering or dispersal and linked to a geographic process.
FAQ
Geographers typically begin by visually inspecting map distributions, but they often use statistical tools to confirm patterns when points appear ambiguous.
Common techniques include:
Nearest neighbour analysis to measure proximity between features.
Spatial autocorrelation tests such as Moran’s I to detect similarity across space.
These methods help distinguish true clustering from patterns that merely look clustered due to map scale or symbol size.
Spatial patterns often change when the scale of analysis shifts because different processes operate at different spatial levels.
A pattern that appears clustered locally may appear dispersed or random at a regional scale if clusters are spread far apart.
Conversely, dispersed local patterns may form a larger cluster when considered within broader national boundaries.
Symbol choice affects how easily patterns can be detected. Large or overlapping symbols may hide dispersal or exaggerate clustering.
To avoid misinterpretation, cartographers often:
Use consistent symbol sizes.
Apply transparency to dense areas.
Adjust symbol placement to reduce overlap without distorting location.
Good symbol design is crucial for accurately identifying spatial relationships.
Distance decay helps explain why clustering often forms around central or highly connected locations.
As interaction decreases with distance, activities such as retail, commuting, and cultural exchange tend to concentrate near focal points.
On maps, this produces dense clusters that gradually thin out, creating a measurable spatial gradient.
Elevation shapes accessibility, climate, and land suitability, which in turn produce distinctive spatial patterns of settlement and activity.
For example:
High elevations tend to show dispersed settlement due to harsher conditions.
Valleys often exhibit clustering due to fertile soils and transport routes.
Steep slopes influence linear patterns as development follows contour lines or valley floors.
These relationships help geographers interpret how physical constraints shape human presence across landscapes.
