
AP Syllabus focus:
‘All maps select what to show; map projections always distort shape, area, distance, or direction when representing Earth.’
Map projections transform Earth’s curved surface onto flat maps, requiring selective choices that inevitably introduce distortion, influencing how geographers interpret spatial patterns and geographic information.
Understanding Map Projections
Map projections are mathematical methods used to represent Earth’s roughly spherical surface on a flat plane. Because a curved surface cannot be flattened without stretching or compressing it, every projection alters at least one spatial property. This makes understanding distortion essential for geographic interpretation.
Distortion: The unavoidable alteration of shape, area, distance, or direction when representing Earth’s curved surface on a flat map.
Geographers evaluate a projection based on which property it preserves and which it distorts. A projection cannot preserve all properties at once, so using maps responsibly requires recognizing how selectivity shapes what is emphasized or minimized.
The Role of Selectivity in Mapmaking
Mapmakers must choose what information to include or exclude—a process known as selectivity.
Selectivity: The purposeful decision by mapmakers to include, exclude, or emphasize particular features to support a specific purpose or interpretation.
This selectivity reflects the cartographer’s goals, whether navigation, thematic analysis, political messaging, or geographical instruction. Between projections and data choices, every map is a constructed representation rather than a neutral copy of Earth.
Normal sentences are needed before moving on. Selectivity affects how spatial patterns appear, shaping users’ perceptions of location, distance, and regional relationships.
Why Distortion Occurs
Distortion results from converting a three-dimensional surface into two dimensions. Since Earth is not a perfect sphere but an oblate spheroid, flattening requires stretching, shrinking, or tearing the surface in some way. The outcome changes how spatial characteristics appear on the map.
Key spatial properties affected by distortion include:
Shape (conformality): How accurately landmasses retain their outlines.
Area (equivalence): Whether map regions maintain proportional size relative to one another.
Distance (equidistance): Accuracy of measured space between locations.
Direction (azimuthality): Reliability of compass bearings from one point to another.
Each projection seeks to minimize specific errors, but improving one aspect worsens another.
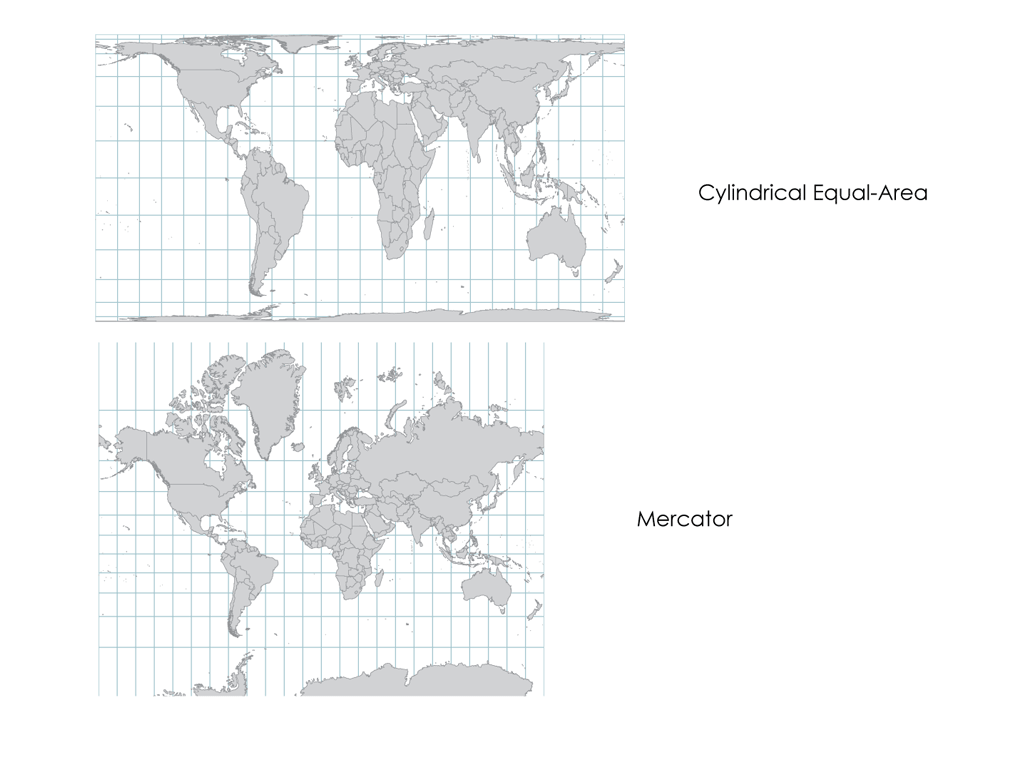
Cylindrical equal-area (top) and Mercator (bottom) projections highlight how preserving area or shape alters the appearance of continents. Note how Greenland appears much larger on the Mercator map, revealing significant shape and area distortion at high latitudes. Additional map details such as boundaries are present but should not distract from the distortion comparison. Source.
Major Categories of Map Projections
Conformal Projections
Conformal projections preserve shape but distort area.
Conformal Projection: A projection that maintains local shape by keeping angles accurate, but enlarges or compresses areas based on latitude.
On these maps, small areas appear correctly shaped, but overall size becomes misleading. For example, regions far from the equator appear much larger than they truly are.
Equal-Area Projections
Equal-area projections preserve area but distort shape. National and international organizations frequently use these maps to represent global demographics, agriculture, or resource distribution accurately.
Normal sentences must appear here before continuing. These projections prevent misleading impressions of the size of continents or countries, making them invaluable for analyzing human and environmental patterns.
Equidistant Projections
Equidistant projections preserve distance from one or two specified points but distort other properties. Because only some distances remain accurate, these maps are used for specialized analysis such as airline route planning.
Azimuthal Projections
Azimuthal projections preserve direction from a central point, making them useful for applications like radio transmission or seismic mapping.
Normal sentences are placed here to ensure proper structure. Each azimuthal map offers accurate bearings outward from its center, but not between other locations on the map.
Selectivity, Political Messaging, and Geographic Interpretation
Because map projections alter Earth’s appearance differently, the choice of projection can shape social and political perceptions. A projection that enlarges high-latitude countries, for example, may appear to exaggerate their geopolitical importance. Selectivity also applies to labeling, color schemes, and thematic categorization, each of which influences interpretation.
Key ways selectivity shapes interpretation include:
Emphasizing certain regions through scale or color choices.
Choosing boundaries that reflect particular political perspectives.
Highlighting patterns such as migration routes or climate zones.
Downplaying spatial inequalities when area or density is misrepresented.
Recognizing these selective choices helps map users critically analyze geographic information rather than accepting it at face value.
Evaluating Projections for Geographic Inquiry
Understanding distortion and selectivity is essential for AP Human Geography because different geographic questions require different mapping tools. Geographers must select projections that best support their analytical goals.
Considerations when evaluating or choosing a projection include:
Purpose of the map: navigation, demographic analysis, visualization, or political context.
Property to preserve: shape, area, distance, or direction.
Scale of analysis: global, regional, or local.
Potential spatial bias: whether distortion may mislead interpretation of patterns.
The ability to identify what has been altered—and why—allows students to use maps as evidence while recognizing their limitations. Understanding these principles supports deeper geographic reasoning across all scales of inquiry.
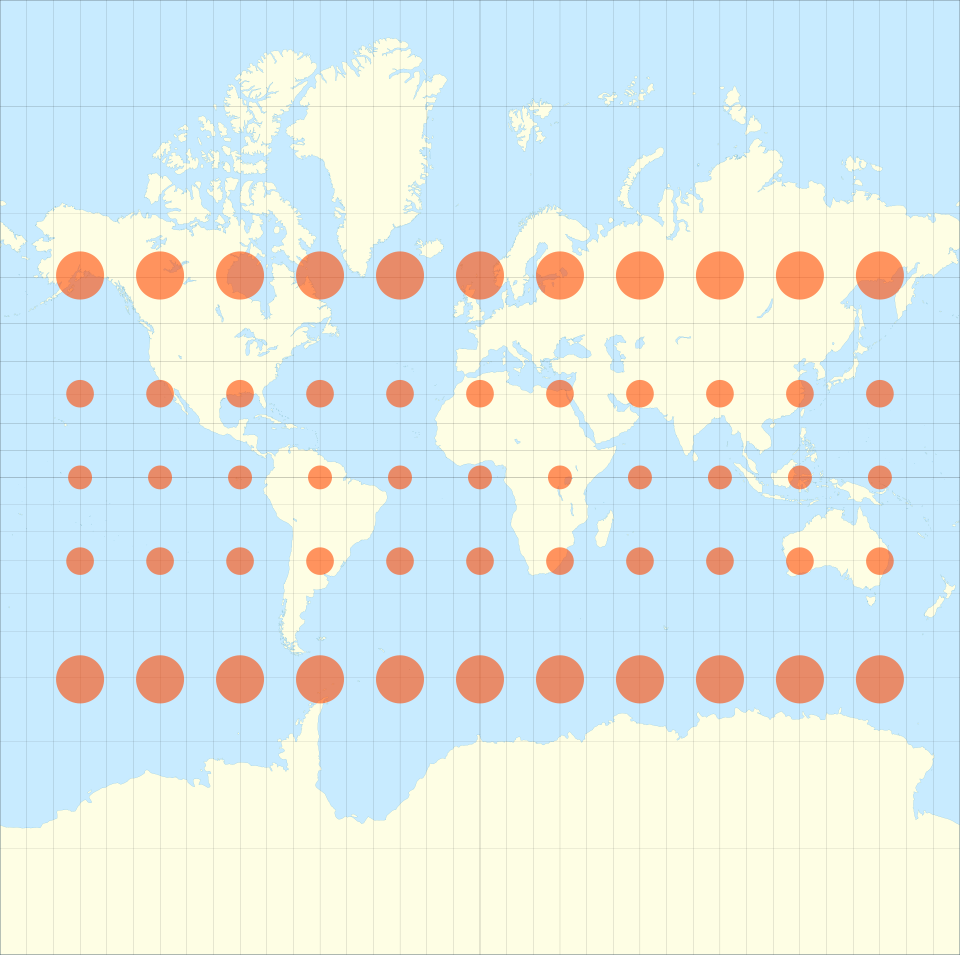
Mercator world map with Tissot’s indicatrices showing how distortion increases toward the poles. Circles become stretched and enlarged, illustrating changes in shape and area across the map. Tissot’s indicatrix is an advanced tool not required by the AP curriculum but effectively visualizes distortion intensity. Source.
Practice Questions
Question 1 (1–3 marks)
Explain why all map projections inevitably introduce distortion. Refer to at least one type of spatial property in your answer.
Question 1
Award up to 3 marks:
• 1 mark for stating that distortion occurs because the Earth is a curved surface that cannot be represented on a flat map without alteration.
• 1 mark for correctly identifying a spatial property that may be distorted (shape, area, distance, or direction).
• 1 mark for explaining how or why that property becomes distorted (e.g., flattening stretches or compresses certain regions).
Full-mark example elements:
“The Earth’s curved surface cannot be flattened without stretching or compressing it (1). This leads to distortions of properties such as area (1), because regions become enlarged or reduced depending on the projection (1).”
Question 2 (4–6 marks)
Assess how selectivity and map projection choice can influence the interpretation of global geographic patterns. In your response, discuss at least two different types of projection distortion and explain how they may affect a user’s understanding of spatial relationships.
Question 2
Award up to 6 marks:
• 1–2 marks for describing selectivity as the mapmaker’s choice of what to include or emphasise.
• 1–2 marks for identifying two types of distortion (e.g., shape and area; distance and direction).
• 1–2 marks for explaining how these distortions affect interpretation, such as exaggerating the size of high-latitude countries or altering perceived spatial connections.
• 1–2 marks for assessing the combined influence of selectivity and projection choice on understanding geographic patterns (e.g., political bias, misleading comparisons, or misinterpretation of global distributions).
Full-mark example elements:
“Selectivity influences which features are shown and highlighted (1). Distortions of shape and area occur in many projections (1–2). Shape distortion may make countries look more elongated than they are, while area distortion can exaggerate the size of high-latitude regions (1–2). Together, these choices can shape how users perceive global patterns, potentially reinforcing biased interpretations or misrepresenting regional importance (1–2).”
FAQ
Textbook maps often prioritise familiarity and ease of comparison across editions, so commonly used projections such as the Mercator or Robinson become default choices.
Publishers also value projections that display political boundaries clearly and maintain recognisable continental outlines, even if this sacrifices accuracy in area or shape.
In addition, educational settings often prefer visually balanced projections that are easy for students to interpret quickly, even when they are not the most geographically precise options.
Distortion may alter how viewers perceive the scale and distribution of patterns across regions.
For thematic maps that rely on area, such as population density or agricultural output, projections that distort size can misrepresent the relative importance of regions.
Climate zones, which span large areas, may appear stretched or compressed, potentially giving an inaccurate impression of their extent or latitudinal position.
Projection choices can subtly reinforce certain narratives by altering spatial relationships between states.
For instance, projections that centre a specific region imply its geopolitical centrality, while others may place the same region on the periphery.
Directional distortions may also affect how viewers perceive accessibility, influence, or proximity between major powers.
Cartographers design maps for specific purposes, and different tasks prioritise different spatial properties.
For example:
• Navigation maps prioritise direction and shape.
• Statistical or demographic maps prioritise area accuracy.
• Route or distance maps may emphasise equidistance from certain points.
Accepting distortion in less important properties allows the map to optimise the property that matters most for its intended use.
Readers can look for visual clues:
• High-latitude areas appearing extremely large suggest a conformal projection such as Mercator.
• Continents that appear horizontally stretched suggest a compromise or pseudocylindrical projection.
• A circular or hemispheric layout often indicates an azimuthal projection.
Comparing the map with a known equal-area representation can also help identify which properties are being distorted.
