
AP Syllabus focus: 'Numbers can convey meaningful information when placed in context. Students identify questions that can be answered using variation in one-variable data.'
Statistics begins with real questions about real data. To interpret numbers well, you must know the setting and recognize when differences among values make a question genuinely statistical.
Why Context Matters
A number by itself does not say very much. The value 72 could describe a test score, a body temperature in degrees Fahrenheit, a daily sales total in dollars, or a heart rate in beats per minute. Context gives the number meaning by connecting it to a real situation.
Context: The real-world information that explains what a value describes, including who or what was measured, the units, and the situation in which the data were collected.
In AP Statistics, numbers should almost never be discussed as if they stand alone. A good interpretation includes the individuals being studied, the variable being recorded, and the units when units exist. Context also includes details such as time, place, and purpose. A value of 15 has a very different meaning if it represents minutes waiting in line rather than years of age.
Context matters because statistical statements are meant to answer questions about actual groups. If you remove the setting, a claim can become vague or misleading. Saying “the values are high” is weak unless you explain high for what and for whom. Statistical reasoning becomes stronger when every claim is tied back to the situation that produced the data.
Variation Makes Statistics Necessary
Statistics is not just about collecting numbers. It is about understanding the fact that numbers usually vary from one observation to another.
Variation: Differences in data values among individuals or observations in the same setting.
If every member of a group gave exactly the same response or had exactly the same measurement, there would be little need for statistical thinking. In most real settings, however, people, objects, and events differ. Heights vary, commute times vary, and numbers of text messages sent per day vary. Even repeated measurements of the same process may differ slightly.
Variation is what makes a question statistical. A statistical question expects answers to differ and is designed to learn from those differences. When you ask how many hours students in a class sleep on a school night, you expect a range of answers rather than one identical value.
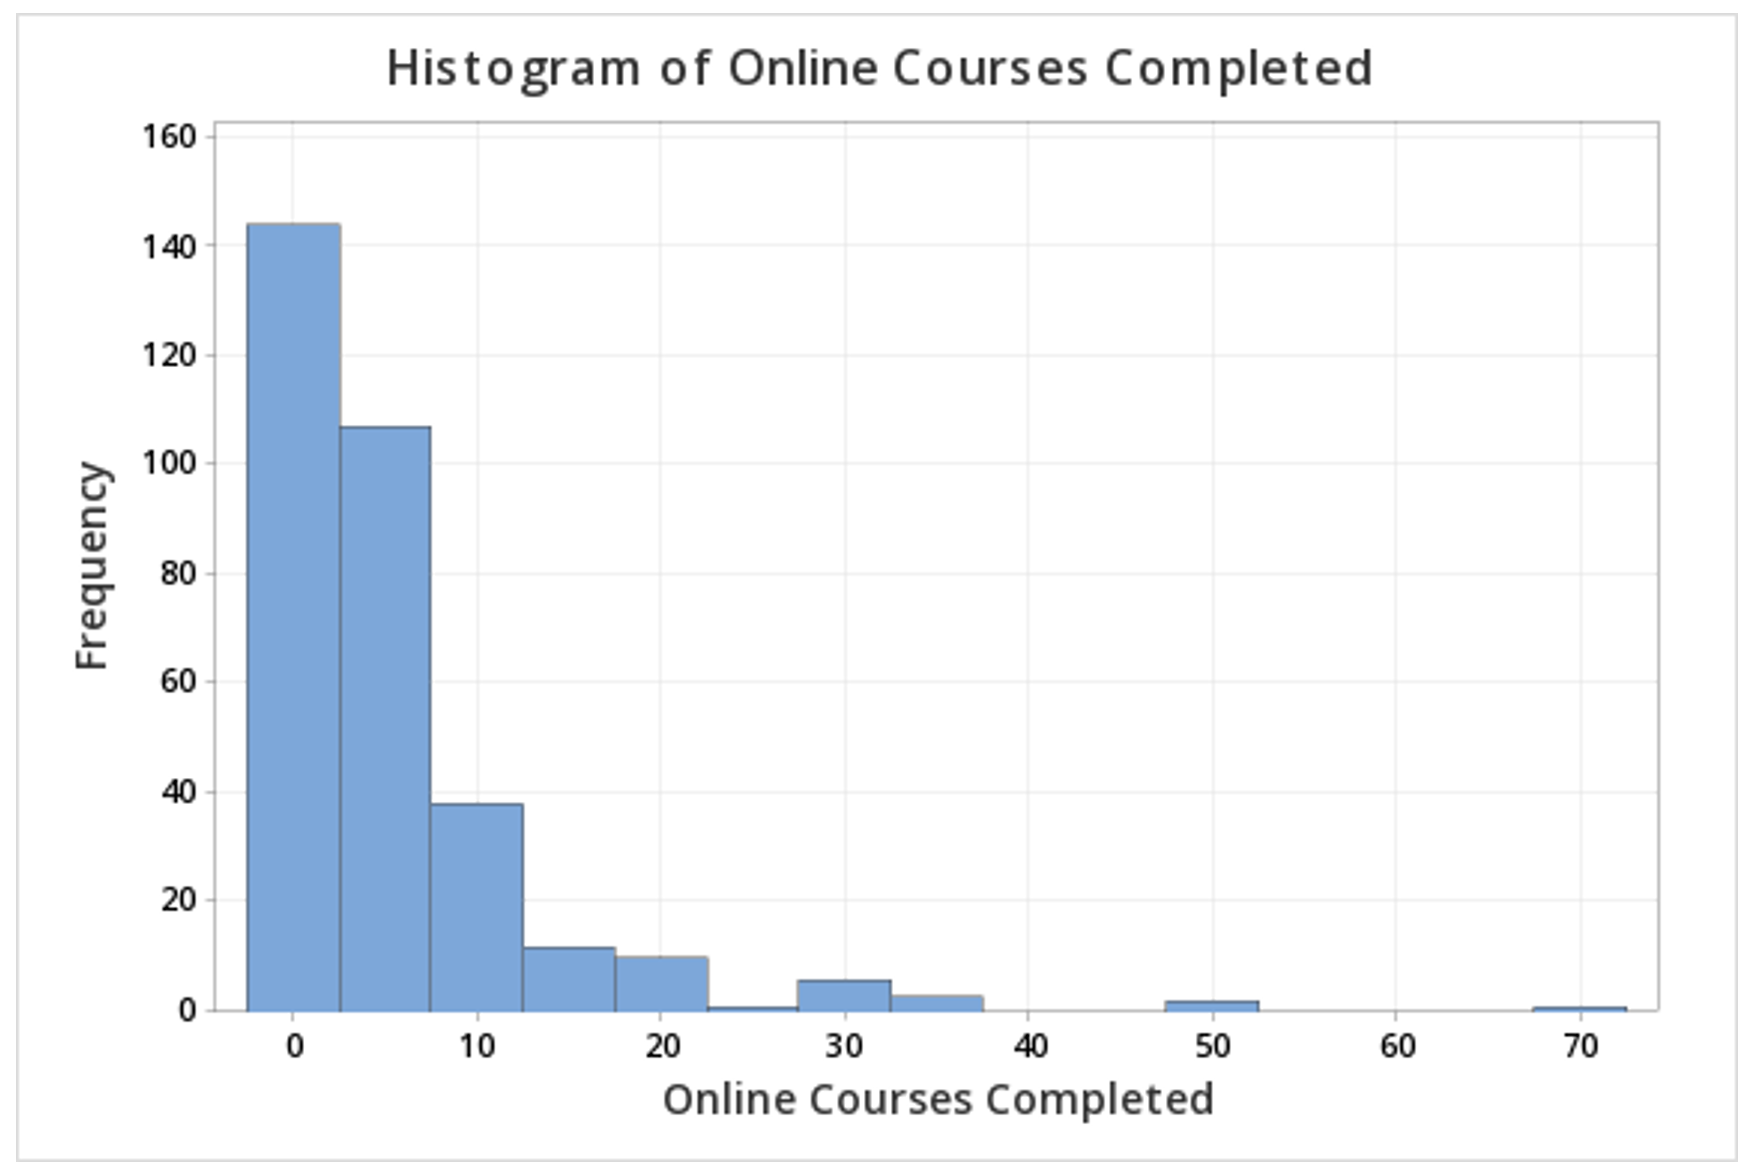
This histogram summarizes one-variable quantitative data by grouping observations into intervals (bins) and plotting their frequencies. The overall shape makes variation easy to see at a glance, including clusters, skewness, and potential outliers. Interpreting this display requires context about who was measured and what the variable represents. Source
That expected spread is the key feature.
Variation also reminds us to be careful with interpretation. One observation does not usually represent an entire group. A single data point may be unusual, typical, or somewhere in between. To learn from data, we look at the pattern of values, not just one number.
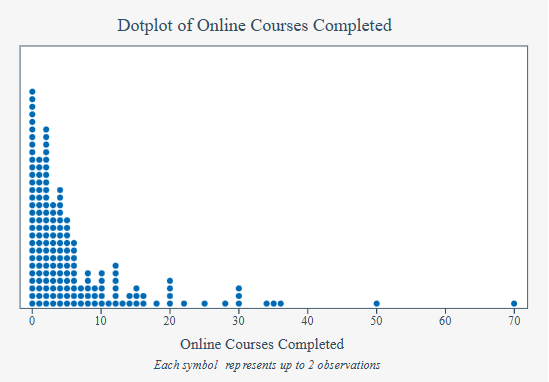
This dotplot displays one-variable quantitative data with one symbol per observation, making individual values and overall spread visible simultaneously. Because each point is explicit, dotplots make it easy to notice clusters, gaps, and possible outliers while still keeping the connection to individual data values. This supports interpreting a distribution as a whole rather than over-weighting a single data point. Source
Questions Answered by One-Variable Data
A question is answerable using one-variable data when each individual contributes one value for a single characteristic of interest.
One-variable data: Data that record one characteristic for each individual in a group.
These questions focus on one feature of a group at a time.
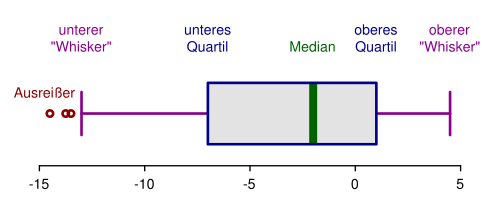
This annotated boxplot labels the median, quartiles, whiskers, and an outlier, showing how a one-variable distribution can be summarized with the five-number summary. Boxplots emphasize variability by visually separating the middle 50% (the box) from more extreme values (the whiskers and outliers). They are especially useful for comparing distributions across groups once context defines what the variable measures. Source
They might ask about how values differ, what values are common, whether values tend to be relatively small or large, or whether there is a lot of variability. The important idea is that only one variable is being recorded for each individual.
Examples of one-variable questions include asking about:
the number of siblings students have
the amount of time workers spend commuting
the preferred music genre of a group of teenagers
In each case, the data set would contain one recorded characteristic per individual. By contrast, a question about whether commute time is related to job satisfaction would require two variables and does not belong to this subsubtopic.
Recognizing Good Statistical Questions
A strong statistical question for one-variable data usually has several features:
It refers to a group, not just one person or one object.
It anticipates variation in the answers.
It can be addressed by collecting one value per individual.
It is specific enough that the data collected will match the question being asked.
Questions that are not statistical often fail because they do not anticipate variability. “What is the temperature in this room right now?” usually seeks one factual value. Likewise, “Did Maya pass her driver’s test?” concerns one individual and does not focus on variation across a group.
Some questions are statistical but not one-variable questions. For example, asking whether screen time is associated with sleep duration expects variation, but it requires two variables. On the AP Statistics exam, it is important to notice this distinction.
When deciding whether a question fits this topic, ask:
Who are the individuals?
What single characteristic is being recorded?
Would the answers vary from one individual to another?
Can the question be answered from one-variable data alone?
If the answer to the last question is no, then the question is outside the scope of one-variable data.
Using Context to Interpret Questions and Data
Context guides not only interpretation of numbers but also interpretation of the question itself. A well-posed question tells you what group is being studied and what kind of response is expected. Without that information, the data may be hard to use or easy to misread.
When reading or writing a statistical question, pay attention to:
the group of interest
the single variable being measured or recorded
the units or categories
the setting in which the data arise
Careful wording matters. “How much do students study?” is less clear than a question that specifies which students, what counts as studying, and the time period involved. In statistics, better context leads to better data, and better data lead to stronger answers.
Practice Questions
A teacher asks, “How many minutes do students in this class spend on homework on a typical weeknight?” Explain why this is a statistical question that can be answered using one-variable data.
1 mark for stating that the question involves a group of individuals, not just one person.
1 mark for stating that the answers are expected to vary from student to student.
1 mark for stating that only one variable is being measured: minutes spent on homework.
A school principal wants to learn about students’ morning routines.
(a) Consider these two questions:
“How many minutes does each student at the school spend traveling to school?”
“Is travel time to school related to how late a student arrives?”
For each question, state whether it is answerable using one-variable data and justify your answer.
(b) Explain why context is necessary when interpreting a number such as 25 in part (a).
(c) Describe one way variation would appear in the data from the first question.
(a) 1 mark for identifying the first question as answerable using one-variable data.
(a) 1 mark for justifying that the first question records one variable per student: travel time.
(a) 1 mark for identifying the second question as not answerable using one-variable data.
(a) 1 mark for justifying that the second question involves two variables: travel time and lateness.
(b) 1 mark for explaining that 25 needs context such as units, the group studied, and what the value represents.
(c) 1 mark for describing variation as differences in travel times across students.
FAQ
Because interpretation depends on more than the values themselves.
The same list of numbers could represent ages, prices, or reaction times. Once the meaning changes, so do the units, what counts as large or small, and what conclusions are reasonable.
Context also affects whether a value seems typical, concerning, or unimportant.
Yes. A question is statistical if it expects variability, even when that variability is limited.
For example, measurements from a highly controlled process may differ only slightly, but those differences still matter. Statistics is concerned with understanding the presence and pattern of variation, not just whether the spread is large.
Very small variation can still be informative in quality control, science, and health studies.
Measurement precision can change how much variation you see.
More precise measurements may reveal small differences that rough measurements hide.
Rounded values can make data look more uniform than they really are.
Different measuring tools may produce slightly different values for the same quantity.
This means some variation reflects real differences among individuals, while some reflects how the data were recorded.
Poor wording can produce unclear or unusable data.
If a question does not define the group, time frame, or response clearly, different people may interpret it differently. That creates ambiguity before any analysis begins.
Good wording helps ensure that each recorded value answers the same question in the same way, which makes the resulting variation meaningful rather than confusing.
Yes. Variation is about differences among individuals, not about whether you sampled or counted everyone.
Even if you collect data from every student in a school, their responses or measurements can still vary widely. A census removes sampling uncertainty about that group, but it does not remove the natural variation within the group itself.
That is why statistical description still matters even when all members are measured.
