
AP Syllabus focus:
‘Skill 1.A: Identify questions that can be answered through statistical analysis of one-variable data. VAR-1.A: Understand the importance of context in interpreting data. Questions should aim to uncover patterns, trends, or potential anomalies within the dataset. VAR-1.A.1: Recognize that numbers and data points convey meaningful information when placed in context, highlighting the significance of understanding the story behind the data.’
Statistical questions arise from recognizing that data vary. Understanding how variation appears and what it suggests allows analysts to pose meaningful, context-driven questions about patterns within one-variable data.
Identifying Questions Based on Data Variation
A statistical question is one that anticipates variability in data and seeks to understand or explain that variation in a meaningful context. This subsubtopic focuses on how to identify such questions, emphasizing the critical role of context, interpretation, and the search for patterns or anomalies within a single quantitative or categorical variable.
Understanding the Role of Context in Formulating Statistical Questions
Context provides the real-world framework that gives meaning to numbers. Without knowing who or what the data describe, when and where they were collected, or how they were measured, numerical values lack interpretive value. Statistical analysis depends on understanding the circumstances surrounding the data so that observations become informative rather than isolated figures.
Graphs of one-variable data reveal where values cluster, how much they vary, and whether any scores are unusually high or low.
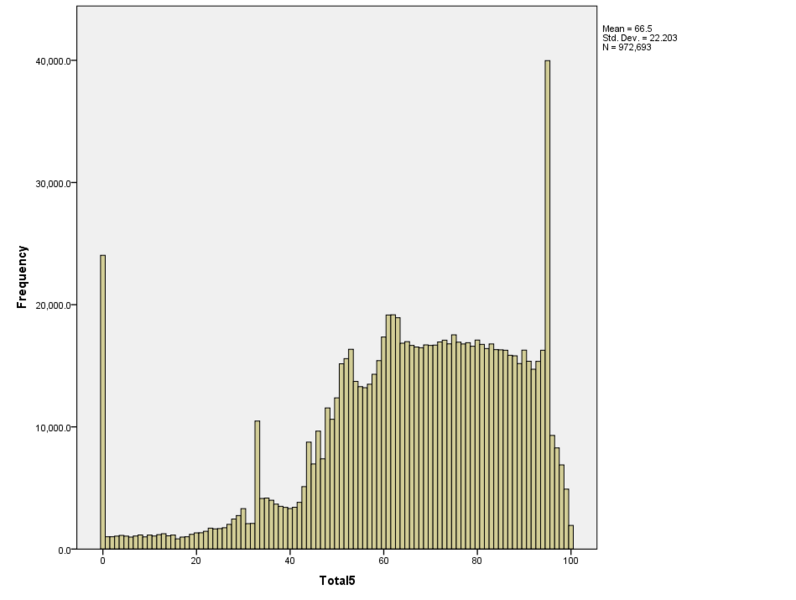
Histogram of students’ marks in a single subject, showing how many students fall into each score range. The distribution’s shape and spread support questions about typical performance and unusual results. Although the context refers to a specific exam, the statistical ideas of variation and distribution apply broadly to one-variable quantitative data. Source.
Why Context Matters
Context identifies the population or group under study.
It clarifies the variable being measured and what its values represent.
It guides interpretation by connecting data patterns to real-world behavior, processes, or conditions.
It helps distinguish meaningful trends from random fluctuations.
When data points are interpreted with context, they tell a coherent story about variation. This aligns with the syllabus requirement that students understand that “numbers and data points convey meaningful information when placed in context.”
What Makes a Question Statistical?
A statistical question anticipates answers that will vary because real-world measurements naturally differ. A question such as “How many minutes do students spend on homework each night?” is statistical because different students report different amounts of time. In contrast, a question like “How long is the AP Statistics exam?” is not statistical because it has a single fixed answer.
Key Characteristics of Statistical Questions
They involve one variable whose values vary across individuals or observations.
They expect distributional answers, not fixed facts.
They aim to reveal patterns, trends, or anomalies.
They require data for resolution, not definitions or authoritative references.
Connecting Variation to Statistical Questions
Variation is central to statistics because it prompts inquiry. When you observe that values differ—hours slept, number of siblings, reaction times—you gain opportunities to ask targeted questions about the nature and structure of that variability.
Types of Variation
Natural variation, arising from inherent differences across individuals.
Measurement variation, resulting from differences in tools or procedures.
Induced variation, produced by external influences or controlled experiments.
Random variation, occurring unpredictably without a systematic pattern.
Systematic variation, displaying consistent directional differences that may indicate trends or underlying processes.
Variation encourages questions such as:
Is there a typical or most common value?
Are some values unusually high or low?
Does the data cluster, spread, or form recognizable shapes?
Do subgroups differ from each other?
These questions align with the syllabus directive that analysis should seek patterns, trends, or potential anomalies.
Asking Effective Questions About One-Variable Data
To formulate strong statistical questions, students must integrate an understanding of the variable, its context, and how its values vary. Good questions lead to meaningful investigation rather than trivial data reporting.
Elements of an Effective Statistical Question
Identifies the variable clearly, ensuring it is measurable and varies.
Specifies the group or population, grounding the question in context.
Anticipates variability, acknowledging that responses will differ.
Focuses on distributional features, such as center, spread, or unusual traits.
Guides analysis, pointing toward a pattern or aspect of variation to explore.
In many real data sets, the variable of interest is categorical, such as people’s opinions about an issue or their preferred option in a poll.
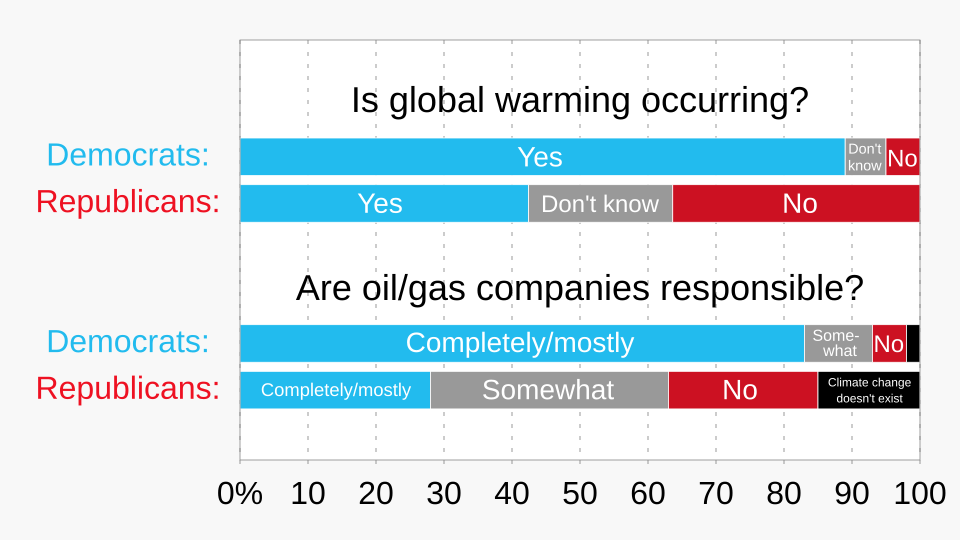
Bar chart of responses to a survey question about beliefs regarding global warming and responsibility for climate change. Differences in bar lengths display variation across categories, supporting questions about common and uncommon viewpoints. This context extends beyond the syllabus content, but the statistical focus remains on interpreting variation in a single categorical variable. Source.
Examples of Question Types (Conceptual Only)
Questions about typical values motivate analysis of center.
Questions about differences within the data encourage examination of spread or clusters.
Questions about unusual results highlight potential anomalies.
Questions about patterns over time or across categories reveal systematic variation.
Sometimes the context involves time, so we might track how a single measure changes across years or decades.
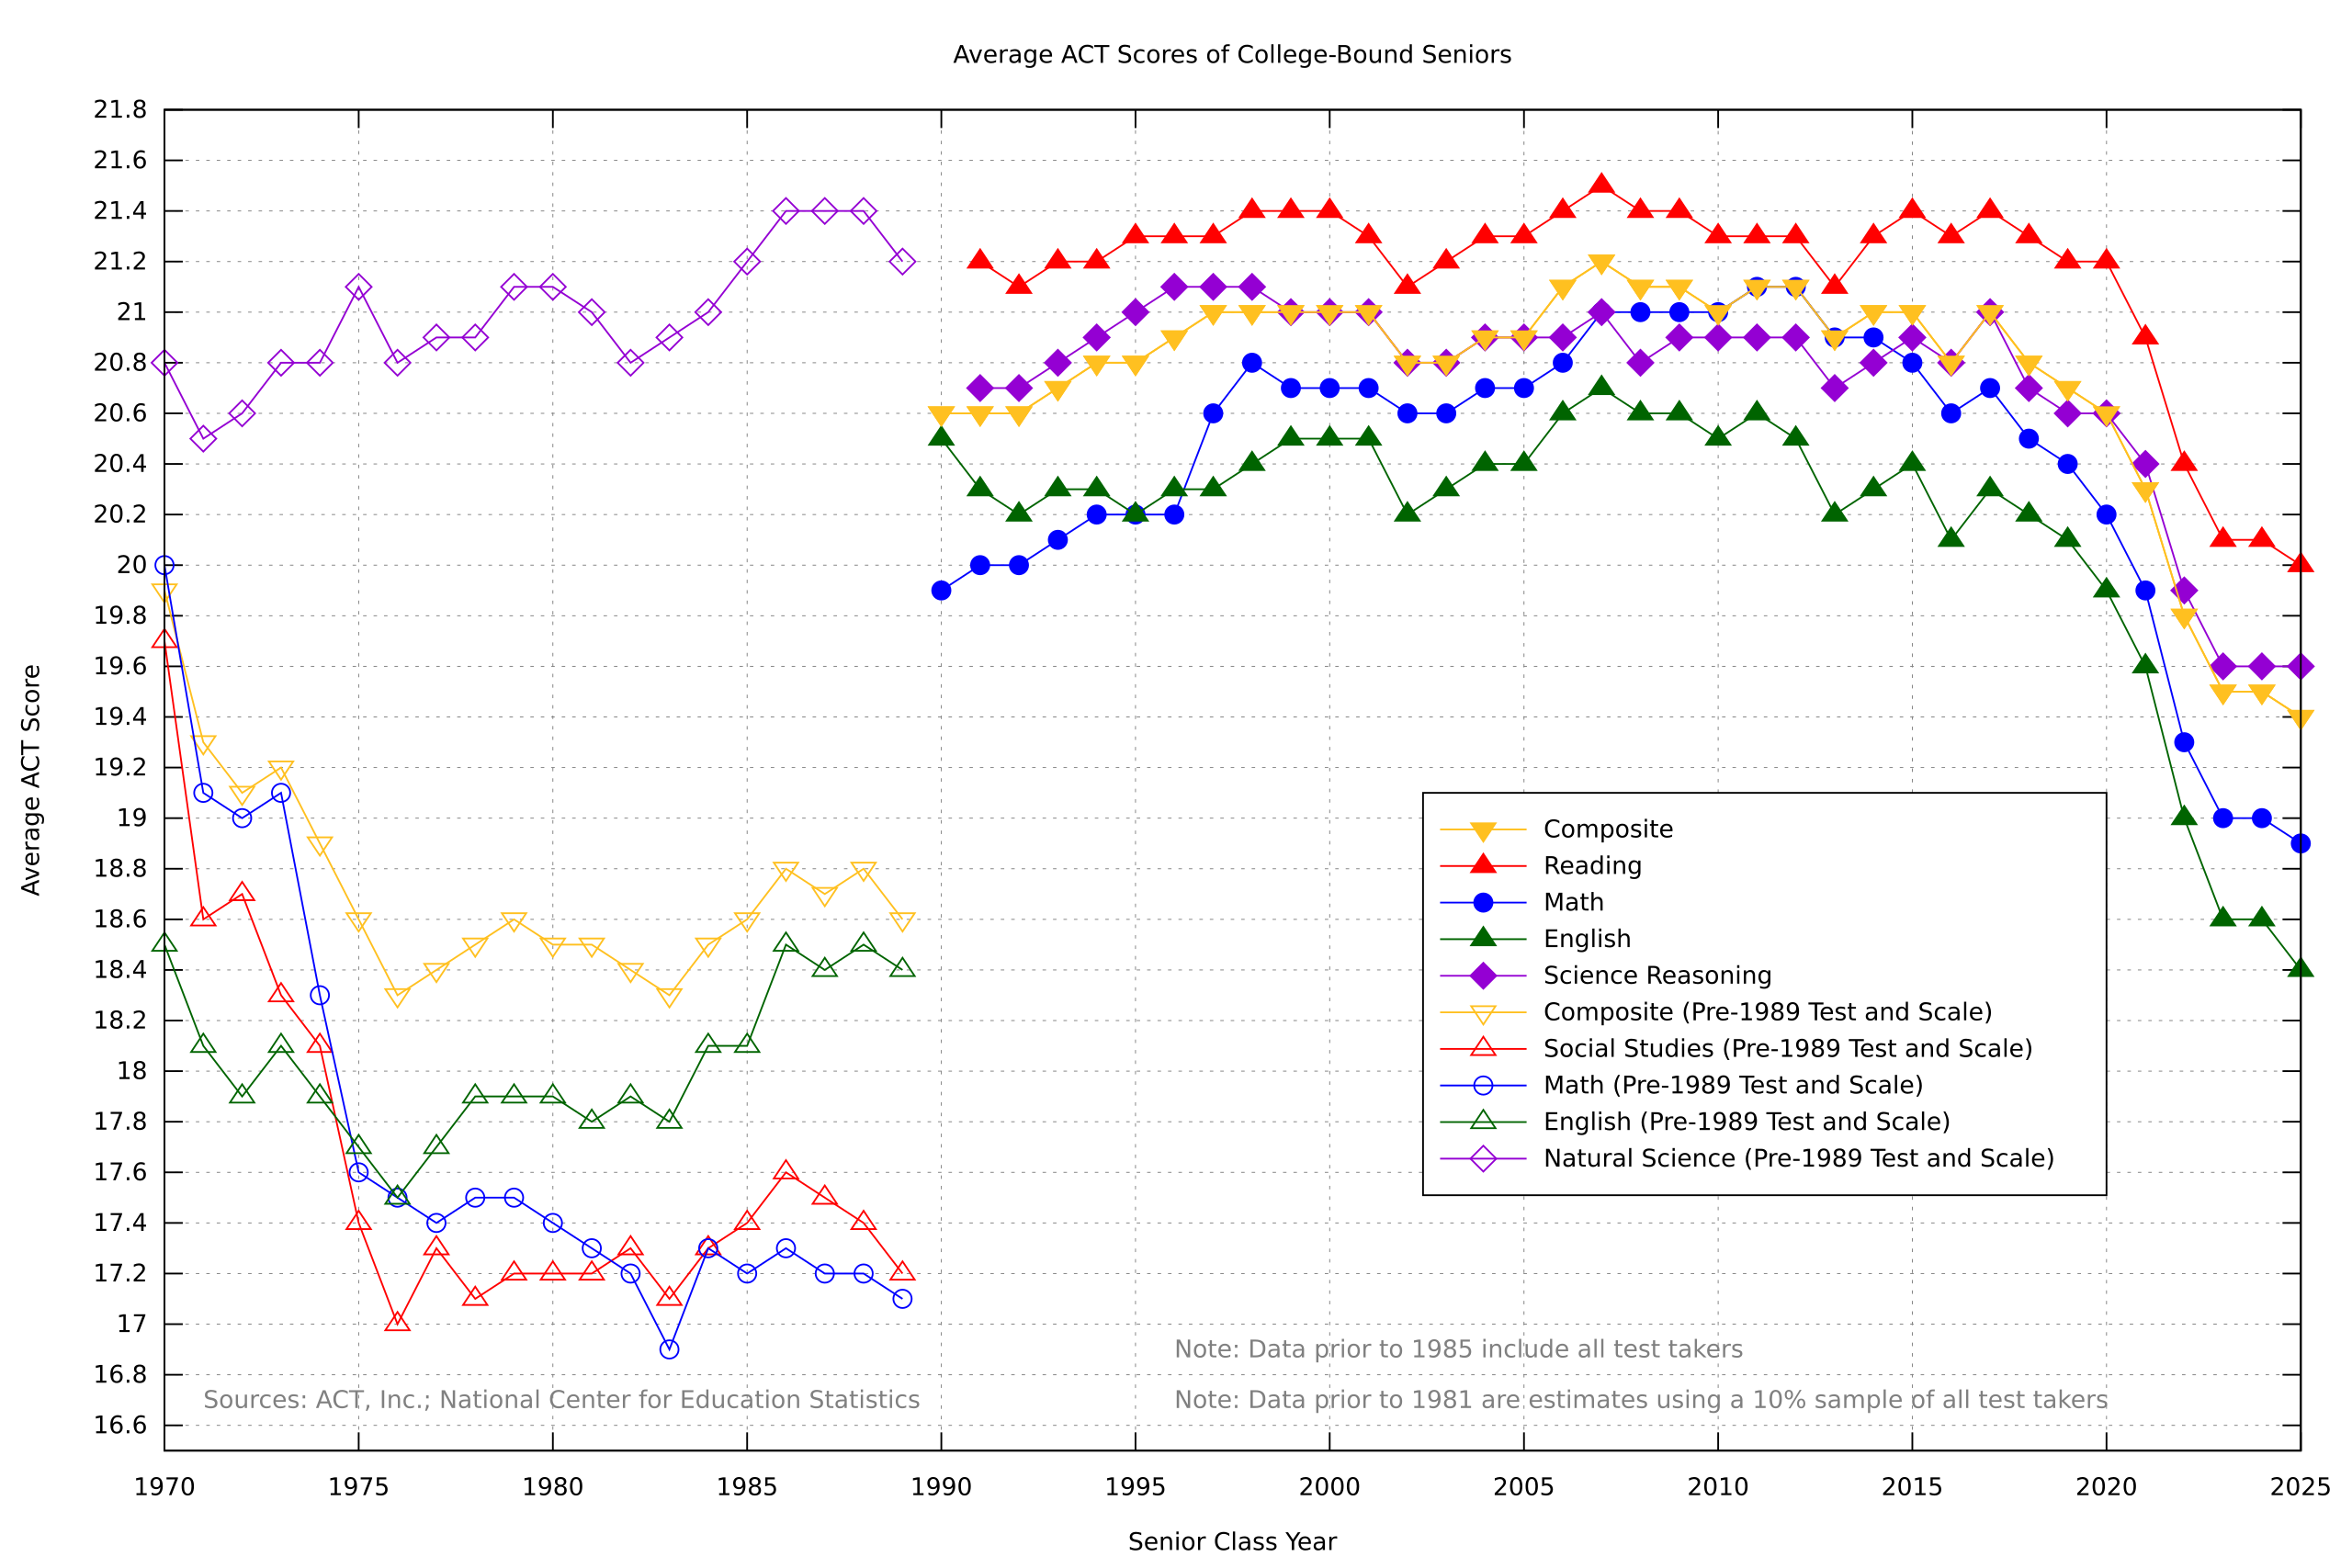
Line graph displaying average ACT composite and section scores for graduating classes across multiple decades. Shifts and fluctuations in the lines illustrate how a single measure can vary over time, prompting questions about changes, trends, and stability. The multiple lines include additional score types not required by the syllabus but still demonstrate temporal variation within one variable. Source.
Using Data Variation to Drive Interpretation
Recognizing that variability produces uncertainty is essential. Because data values differ, conclusions should be drawn with caution, supported by context and distributional evidence. Statistical questions ultimately aim to reduce this uncertainty by extracting meaningful structure from variation.
Key Practices When Interpreting Variation
Look for patterns before drawing conclusions.
Consider whether observed patterns reflect the context or external factors.
Distinguish random variation from meaningful structure.
Use variability-aware questions to guide careful and justified interpretation.
Understanding and identifying questions based on variation prepares students to engage authentically with statistical reasoning. By grounding questions in context and variability, analysts begin the work of uncovering the story behind the data—a skill central to all statistical inquiry.
FAQ
A question relies on variation if the answer cannot be given by a single fixed value but instead requires examining how measurements differ across repeated trials or different individuals.
Look for indicators such as expected spread, uncertainty, or conditions that influence the outcome. If removing variation would make the question meaningless, it is a statistical question.
Context determines what the measurements represent, how they were taken, and which physical factors might influence variation.
It prevents misinterpretation by linking the data to the real system being studied, helping you judge whether differences are meaningful, expected, or indicate a fault in the setup.
Random variation prompts questions about spread, uncertainty, or typical values.
Systematic variation prompts questions about trends, consistent shifts, or possible biases in the measurement process. Differentiating them helps you target the underlying cause rather than just the numerical outcome.
Anomalies draw attention to unexpected behaviour, prompting questions about whether they arise from equipment faults, external influences, or genuine physical effects.
They also encourage deeper investigation into measurement conditions, improving experimental design and highlighting whether the anomaly is repeatable or isolated.
Subgroups may differ due to physical characteristics, experimental conditions, or methodological constraints.
Recognising them allows you to ask more precise questions, such as whether variation differs between groups or whether one subgroup shows a narrower spread.
This helps uncover patterns that would remain hidden if the data were treated as a single uniform set.
Practice Questions
Question 1 (2 marks)
A researcher observes that repeated measurements of the same physical quantity vary slightly each time.
(a) State one possible source of random variation in these measurements.
(b) Explain why recognising such variation is important when forming a scientific question.
Question 1 (2 marks)
(a) One mark for any suitable source of random variation, e.g.:
Human reaction time when reading the instrument (1)
Small fluctuations in environmental conditions (1)
Instrumental noise or minor mechanical irregularities (1)
(b) One mark for:
Explaining that recognising variation helps form questions that anticipate differing outcomes and allows identification of patterns or anomalies in data (1)
Question 2 (5 marks)
A physics teacher records the times (in seconds) taken by 30 students to complete a reaction-time test. The results show noticeable spread, a few unusually high values, and a cluster around 0.25 s.
(a) Explain why a question such as "What is the typical reaction time of students in this class?" is considered a statistical question.
(b) Describe two further statistical questions that could be asked about this one-variable dataset, and explain how each relates to observed variation.
(c) Suggest one reason why the unusually high values might require additional investigation.
Question 2 (5 marks)
(a) Up to 2 marks:
Identifying that the question is statistical because the data vary between students (1)
Noting that the answer requires analysing a distribution, not a single fixed value (1)
(b) Up to 2 marks (1 mark per question + 1 mark per explanation):
Any two valid statistical questions, such as:
"How spread out are the reaction times?" linked to describing variability (1+1)
"Are there any outliers in the data?" linked to identifying unusually large or small values (1+1)
"Does the class show a clear cluster or typical range of times?" linked to observing the cluster near 0.25 s (1+1)
(Maximum 2 marks awarded for this section.)
(c) One mark for any plausible reason, e.g.:
Unusually high times may indicate measurement error, distraction, misunderstanding of the task, or faulty equipment (1)
