
AP Syllabus focus: 'Numerical summaries such as means, standard deviations, and relative frequencies can be used to compare two or more independent samples.'
When groups are compared, well-chosen numbers often communicate differences more clearly than long descriptions. AP Statistics expects you to compare samples by explaining what the summaries show in context.
What numerical summaries do in comparisons
A numerical summary condenses a data set into a small number of values. In this subtopic, the goal is not just to report those values, but to use them to compare two or more independent samples clearly and accurately.
Independent samples: Samples taken from separate groups, or from unrelated observations, so that the observations in one sample do not determine the observations in another sample.
When comparing samples, the summaries should describe the same variable measured in the same units. A comparison is only meaningful if the groups are genuinely comparable. For example, comparing mean test scores across two classes makes sense, but comparing a mean score in one group to a mean height in another does not.
A strong AP Statistics comparison does more than list numbers. It explains:
which sample has the larger or smaller value
whether the difference is large or small
what the difference means in context
Comparing centers with the mean
The mean is often used to compare the typical level of a quantitative variable across samples. If one sample has a larger mean, that sample tends to have larger values on average.
When comparing means:
state which sample has the higher mean
give the amount of the difference when useful
describe the result in the language of the problem
For example, a good comparison uses phrasing such as:
“Sample A has the higher mean waiting time.”
“The mean score for Group 1 is about 4 points higher than the mean score for Group 2.”
This is better than simply writing two means separately. AP readers want a comparative statement, not two disconnected facts.
It is also important to be careful with interpretation. A higher mean does not automatically mean “better” unless the context supports that idea. In some settings, a lower mean is preferable, such as mean repair time or mean number of errors.
Comparing variability with the standard deviation
A comparison based only on means can be incomplete. Two samples may have similar means but differ a lot in how spread out their values are. That is why standard deviation is useful in comparisons.
A smaller standard deviation means the data values are generally less spread out around the mean.
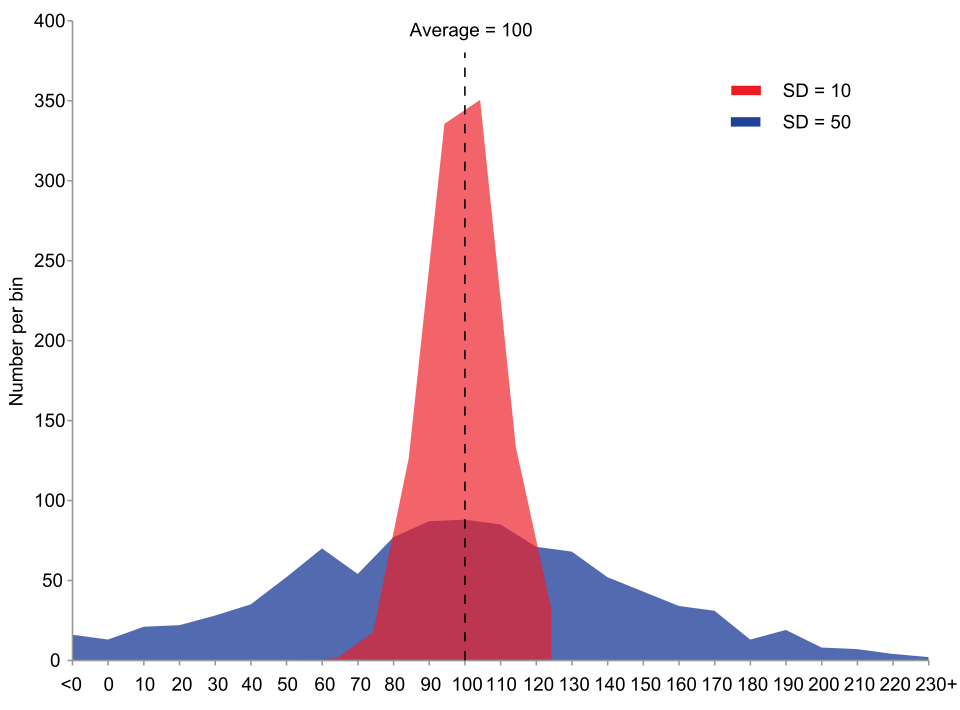
Two normal distributions are shown with the same mean but very different standard deviations. The narrow curve represents a sample with smaller standard deviation (more consistency), while the wider curve represents a sample with larger standard deviation (more variability). This visual reinforces why comparing variability can change the interpretation even when centers match. Source
A larger standard deviation means the sample is more variable.
When comparing standard deviations:
identify which sample is more variable
identify which sample is less variable
connect that difference to consistency in context
Useful comparative language includes:
“Sample B is more variable than Sample A.”
“The results for Group 2 are more consistent because the standard deviation is smaller.”
A complete comparison often discusses both center and variability. For example, one sample may have a slightly higher mean but also much greater variability. That tells you the higher typical value is accompanied by less consistency.
Comparing groups with relative frequencies
Sometimes the most useful numerical comparison is based on relative frequencies, especially when sample sizes are different. Raw counts alone can be misleading because a larger sample often produces a larger count even when the proportion is not larger.
Relative frequency: The proportion of observations in a sample that fall in a category, found by dividing the category count by the sample size.
Relative frequencies are often written as:
proportions, such as 0.42
percentages, such as 42%
These forms communicate the same idea. When comparing samples, relative frequencies allow a fair comparison of shares, not just totals.
A good comparison might say:
“A larger proportion of students in Sample X preferred the later start time.”
“Although Sample Y had more students in the category, Sample X had the higher relative frequency.”
This is especially important when the groups are not the same size.
Writing effective comparison statements
Be explicit and contextual
Name the groups, identify the statistic, and describe the difference in context. Avoid vague statements such as “they are different.” Instead, explain how they differ.
Better comparison language includes:
“The mean lifetime is higher for Brand A.”
“Store C has the smallest standard deviation, so its delivery times are the most consistent.”
“School 1 has the greatest relative frequency of students participating.”
Compare, do not just report
A list of summaries is not the same as a comparison. For AP Statistics, use words such as:
higher
lower
greater
smaller
more variable
less variable
similar
These signal that you are analyzing the relationship between the samples.
Organize carefully with more than two samples
If there are three or more samples, organize your response logically:
compare means from largest to smallest
compare standard deviations from most variable to least variable
point out any group that stands out
This makes the comparison easier to read and more statistically precise.
Common mistakes to avoid
Comparing counts when the sample sizes are different, instead of using relative frequencies
Mentioning only the mean and ignoring standard deviation
Reporting summaries for each group separately without making a direct comparison
Using words like “better” or “worse” when the context does not justify that judgment
Forgetting to include the units or the context of the variable
Comparing samples that are not clearly independent
Treating a very small numerical difference as important without describing whether it is actually notable in context
Practice Questions
Two independent samples of plants were grown using different fertilizers. For Fertilizer A, the mean height was 31.2 cm and the standard deviation was 4.1 cm. For Fertilizer B, the mean height was 28.7 cm and the standard deviation was 3.9 cm.
Compare the two samples.
1 mark: States that Fertilizer A has the higher mean height, or that the mean height is about 2.5 cm greater for Fertilizer A.
1 mark: States that the variability is similar, or that Fertilizer B is slightly less variable because its standard deviation is smaller.
Three independent samples of students were surveyed about whether they ride the bus to school.
School R: 126 out of 210 students ride the bus. School S: 88 out of 160 students ride the bus. School T: 63 out of 140 students ride the bus.
a) Find the relative frequency of students who ride the bus for each school.
b) Compare the three schools using the relative frequencies.
c) Explain why raw counts alone are not enough for this comparison.
1 mark: Correct relative frequency for School R: 0.60 or 60%.
1 mark: Correct relative frequency for School S: 0.55 or 55%.
1 mark: Correct relative frequency for School T: 0.45 or 45%.
1 mark: Correct comparison, such as School R has the highest relative frequency, School T the lowest, and School S is in between.
1 mark: Explains that the sample sizes are different, so proportions or relative frequencies allow a fair comparison while raw counts do not.
FAQ
There is no universal cutoff.
A difference should be judged using:
the context of the variable
the scale of measurement
the amount of variability in the samples
For example, a 2-point difference may matter a lot on one scale and very little on another. In AP Statistics, it is better to describe the size of the difference carefully than to label it important without support.
Yes.
Two samples can share the same mean and standard deviation but still differ in other ways, such as:
clustering
tail behavior
unusual values
overall pattern
This is one reason numerical summaries are powerful but not complete. They describe major features efficiently, but they do not capture every detail of a sample.
Either form is acceptable because they represent the same information.
Percentages are often easier for general audiences to read, especially in written comparisons. Decimals may be more convenient in calculations or when comparing several groups quickly. The key is consistency: once you choose a form, use it clearly across all groups.
Use the number of nonmissing observations as the sample size for the summary you compute.
Also be cautious when comparing groups if one group has much more missing data than another. Large differences in missingness can make comparisons less trustworthy, even if the reported means or relative frequencies look straightforward.
You can, but you should be careful.
A standard deviation is measured in the same units as the data, so the comparison is direct. However, when group means are on very different scales, the same standard deviation may represent different levels of relative spread. In AP Statistics, the safest approach is to describe what the standard deviations show and avoid overstating the comparison.
