
AP Syllabus focus: 'A parameter is a numerical summary of a population. Some data sets may be described as approximately normally distributed.'
Statisticians use numerical summaries and idealized models to describe populations. This topic introduces parameters and explains when a normal distribution model is a reasonable way to represent quantitative data.
Parameters and Populations
A population is the entire group of individuals or observations of interest. When statisticians want to describe that whole group with a number, they use a parameter. A parameter is tied to the population itself, not just to the data collected from part of it.
Parameter: A numerical summary that describes a population.
Parameters are fixed for a given population, even when their values are unknown. Common population parameters include a population mean, a population proportion, and a population standard deviation. The key idea is that a parameter answers a question about the entire population, so context matters. A number only becomes meaningful when it is connected to the group it describes.
Why parameters matter
Parameters help statisticians summarize important features of a population with a single value. That value may describe center, variability, or the proportion in a category. In practice, the full population is often hard to measure, so the parameter may not be directly known. Even so, it still represents the true population quantity that statistical work is trying to understand.
Normal Distribution Models
A normal distribution model is an idealized model used for some quantitative variables. It represents a smooth, symmetric, bell-shaped distribution with one central peak and tails that decrease on both sides.
Normal distribution model: A smooth, symmetric, bell-shaped model that may provide a useful description of the distribution of a quantitative variable in a population.
The word model is important. A model is not an exact copy of real data. Instead, it is a simplified mathematical description that captures an overall pattern. Real data usually have small irregularities, but a normal model can still be useful if the general shape is close enough.
Approximate normality in practice
A data set is approximately normally distributed when its distribution is reasonably close to the shape of a normal model. It does not need to be perfectly smooth or perfectly symmetric. Real-world data often show minor bumps because of natural variation, measurement limits, or the way the data were collected.
When deciding whether a normal model is reasonable, look for features such as:
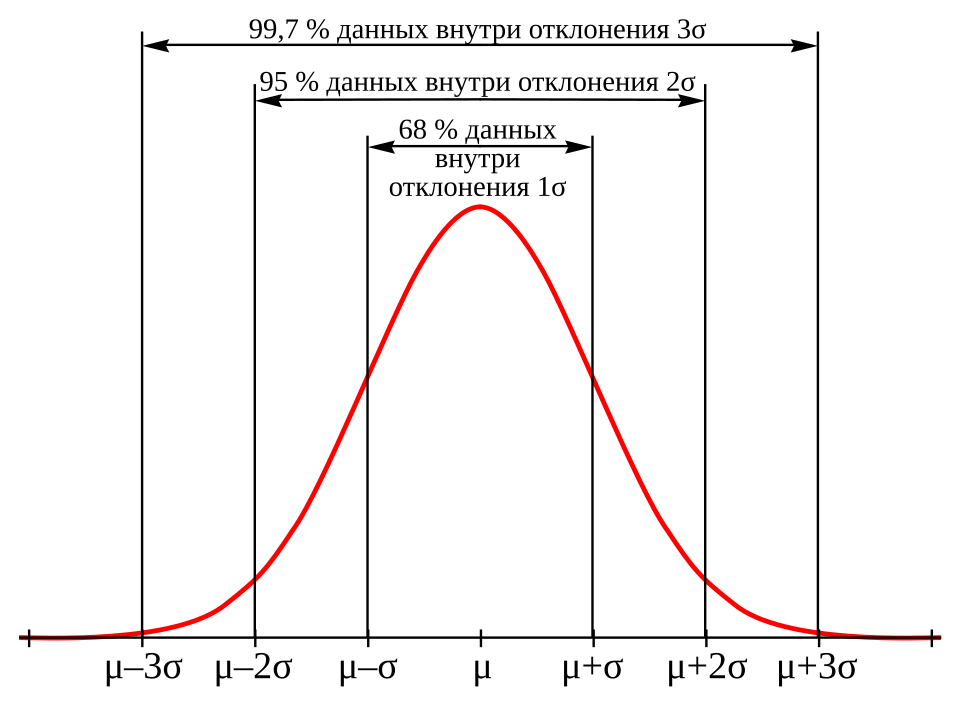
A normal distribution annotated with the 68–95–99.7 (empirical) rule, showing the approximate proportion of values within 1, 2, and 3 standard deviations of the mean. The graphic emphasizes the model’s symmetry and how tail areas shrink as you move farther from the center. Source
one clear peak
rough symmetry around the center
tails that taper off on both sides
no strong outliers
no severe skewness
Because normality is a modeling idea, small departures from the ideal shape are acceptable. However, some distributions are clearly not close to normal. A graph with several peaks, a long tail on one side, or obvious gaps usually is not well described by a normal model.
Parameters in a Normal Model
A normal distribution model for a population is identified by population parameters. In AP Statistics, normal models are often written as , where is the population mean and is the population standard deviation.
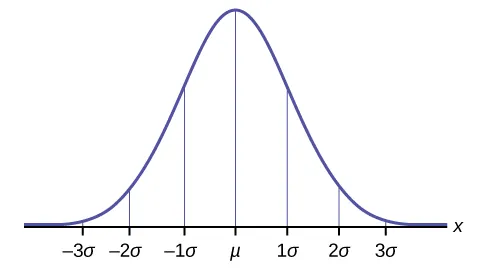
A labeled normal curve partitioned into 1-standard-deviation bands on either side of the mean. The percentages in each band visually connect the parameters (location) and (scale) to how probability mass is distributed across the bell shape. Source
These parameters describe which normal model is being used:
locates the center of the population distribution
describes how spread out the population values are
Two distributions can both be normal in shape but still represent different populations because their parameter values differ. This is why the title of this topic combines parameters and normal distribution models: the model is a description of a population, and the parameter values specify that description.
Deciding Whether a Normal Model Is Reasonable
A normal model is most useful when the distribution of a quantitative variable has a shape that is close to bell-shaped and symmetric. The decision should come from both the graph and the context.
A normal model may be reasonable when:
the distribution is unimodal
the distribution is roughly symmetric
there are no extreme values far from the rest
the overall pattern is smooth rather than sharply uneven
A normal model may be inappropriate when:
the distribution is strongly skewed
there are multiple clusters or peaks
outliers stand apart clearly
the variable is forced into a shape that cannot resemble a bell-shaped pattern
Students should use cautious language. It is better to say that a distribution is approximately normal or that a normal model seems appropriate than to say the data are exactly normal. Statistical models are tools for description, not perfect copies of reality.
Language to Use on AP Statistics
Clear wording is important when writing about this topic. Good AP-style statements include:
"The parameter describes the population."
"A normal model is an approximation to the distribution of a quantitative variable."
"The distribution appears roughly symmetric and unimodal, so a normal model may be reasonable."
"Because the data show strong skewness or clear outliers, a normal model is not appropriate."
This language shows two important ideas at once: a parameter is about a population, and a normal distribution model is only used when the data pattern is close enough to that ideal form.
Practice Questions
A researcher wants to report the average number of hours of sleep for all students at a high school. Is this average a parameter? Explain.
1 mark for identifying the average as a parameter.
1 mark for explaining that it describes the entire population of students at the high school, not just part of it.
The distribution of resting pulse rates for a large population of healthy adults is described as single-peaked, roughly symmetric, and without any extreme outliers.
(a) Explain why a normal distribution model might be appropriate for this population. (2 marks)
(b) The model is written as . State what and represent in this context. (2 marks)
(c) A student says, “Since real data are never perfectly bell-shaped, a normal model should never be used.” Do you agree? Explain. (1 mark)
(a) 1 mark for stating that the distribution is roughly symmetric and unimodal.
(a) 1 mark for noting that the absence of extreme outliers supports using a normal model.
(b) 1 mark for identifying as the population mean pulse rate.
(b) 1 mark for identifying as the population standard deviation of pulse rate.
(c) 1 mark for explaining that a normal model is an approximation and can still be useful when the data are close to normal overall.
FAQ
Many quantitative measurements are influenced by many small, separate factors rather than one single cause.
When these small effects combine, the overall pattern often becomes roughly symmetric and centered around a typical value. That is one reason normal models appear often in biology, psychology, and measurement settings.
Usually, no.
A normal distribution extends infinitely in both directions, so a variable with a strict lower bound, upper bound, or both cannot be exactly normal. For example, a measurement that cannot go below zero cannot follow a perfect normal distribution.
However, it may still be approximately normal if the bounds are far from the main body of the data.
Graph design can strongly affect appearance.
Different histogram bin widths can change the apparent shape.
Small samples can make a graph look uneven.
Rounded measurements can create artificial spikes.
A dotplot may reveal features that a histogram hides.
That is why statisticians do not rely on one visual impression alone.
Yes.
A sample is only a subset of the population, so random variation can make the sample look somewhat irregular, especially when the sample size is small.
A population model describes the long-run pattern of the whole population, not the exact appearance of every sample taken from it.
A normal population model describes the distribution of individual values in a population.
A normal sampling distribution describes how a statistic would vary across many repeated samples.
Both can involve a normal shape, but they describe different things:
population model: individual observations
sampling distribution: values of a statistic across samples
