
AP Syllabus focus:
‘A sample statistic, used as a point estimator, serves to estimate the corresponding population parameter. This process involves both the calculation of the statistic from sample data and an understanding of its role as a point estimate for a broader population characteristic. Calculating and interpreting point estimates are core skills in statistical analysis.’
Point estimates provide a single, data-based value used to infer an unknown population parameter, forming the foundation of statistical reasoning and guiding meaningful interpretations of real-world data.
Calculating Point Estimates
Understanding point estimation is essential because statistical inference begins with using sample information to estimate population characteristics. A point estimate is a single number computed from sample data that acts as the best available guess for an unknown population parameter. In AP Statistics, a sample statistic serves as the point estimator, meaning that the method of calculation and interpretation must reflect both the structure of the sample and the goal of estimating the corresponding parameter.
Point Estimate: A single numerical value computed from sample data that is used to estimate an unknown population parameter.
The process of calculating point estimates centers on identifying which statistic corresponds to which parameter. This requires careful alignment between what is measured in a sample and what is inferred about a population. Because point estimates summarize sample evidence, they serve as the starting point for confidence intervals, hypothesis tests, and other inferential procedures students encounter later in the course.
The reliability of a point estimate depends on how well the sample represents the population. Although issues such as bias and sampling variability are addressed in related subtopics, this subsubtopic emphasizes the mechanical and conceptual process of calculating the statistic itself.
Instead, we collect a sample, compute a sample statistic, and use that value as a point estimate for the population parameter.

This diagram shows how a sample is drawn from a larger population using a sampling method, and how results from the sample are used to make inferences about the population. It emphasizes the directional link from the population to the sample and back again through inference, illustrating the role of point estimates. The image does not introduce any additional concepts beyond this relationship. Source.
Key Ideas in Point Estimation
Parameters vs. Statistics
Population parameters such as the population mean, population proportion, or population standard deviation describe entire populations. Because full population data are typically unavailable, statistics calculated from samples—such as the sample mean, sample proportion, and sample standard deviation—become practical substitutes.
Statistic: A numerical summary calculated from sample data used to estimate a population parameter.
When using statistics as estimators, the alignment is direct:
The sample mean is the point estimator for the population mean.
The sample proportion is the point estimator for the population proportion.
The sample standard deviation can serve as a point estimator for the population standard deviation.
A clear understanding of this pairing enables students to correctly choose which estimator to calculate in a given context.
Calculating a Point Estimate
AP Statistics emphasizes using real sample data to produce the statistic. The procedure typically follows a structured sequence:
Identify the parameter of interest.
Determine the statistic that serves as its estimator.
Extract or compute necessary sample values.
Calculate the statistic using appropriate formulas.
Report the estimate clearly with correct units when applicable.
Because point estimates are single-number summaries, clarity in interpretation is essential. Students must understand that although these values represent the “best guess,” they are inherently subject to sampling variation.
EQUATION
= Sample mean, in the original units of measurement
= Sample size
= Individual sample observations
This formula illustrates how a widely used point estimate is computed directly from sample observations. The same principle applies to other statistics, such as the sample proportion, which reflects the fraction of sample units exhibiting a particular attribute.
A point estimate is not evaluated solely on its numerical value; its context also matters. For example, a point estimate should always be expressed using relevant measurement units (such as hours, dollars, or percentages) to maintain alignment with the population characteristic being estimated.
Interpreting Point Estimates
The Role of Point Estimates in Statistical Inference
Once calculated, a point estimate becomes the anchor for more complex inferential reasoning. The estimate itself does not quantify uncertainty; it simply represents the observed value. However, understanding its meaning allows students to connect sample outcomes to broader population questions.
Interpretation must reflect:
The specific variable measured,
The population the sample represents, and
The real-world context that gives meaning to the estimate.
Characteristics of Effective Point Estimates
A strong point estimator allows for useful and interpretable conclusions. Students should recognize several desirable features:
Accuracy: The estimate should reflect the true parameter as closely as possible.
Consistency: Larger samples typically produce estimates closer to the population value.
Clarity: Units and context must be explicitly communicated.
Relevance: The statistic must correspond directly to the parameter of interest.
Even though bias and variability are covered elsewhere in the syllabus, this subsubtopic highlights that an estimator’s role is to capture a population characteristic responsibly and meaningfully.
Practical Considerations in Using Point Estimates
Reporting Estimates
When presenting a point estimate, students should express the value in clear, context-appropriate language.
Report using correct units.
Identify the population.
State the variable measured.
Clarify that the value is an estimate derived from sample data.
Connecting Point Estimates to Real Data
AP Statistics emphasizes using real sample summaries as estimators rather than theoretical or symbolic quantities. Therefore, students should always ground point estimates in the actual data collected and verify that the statistic selected aligns with the population question being addressed.
If we could take many random samples of the same size from the population, we would get a different point estimate from each sample, and these values form the sampling distribution of the estimator.
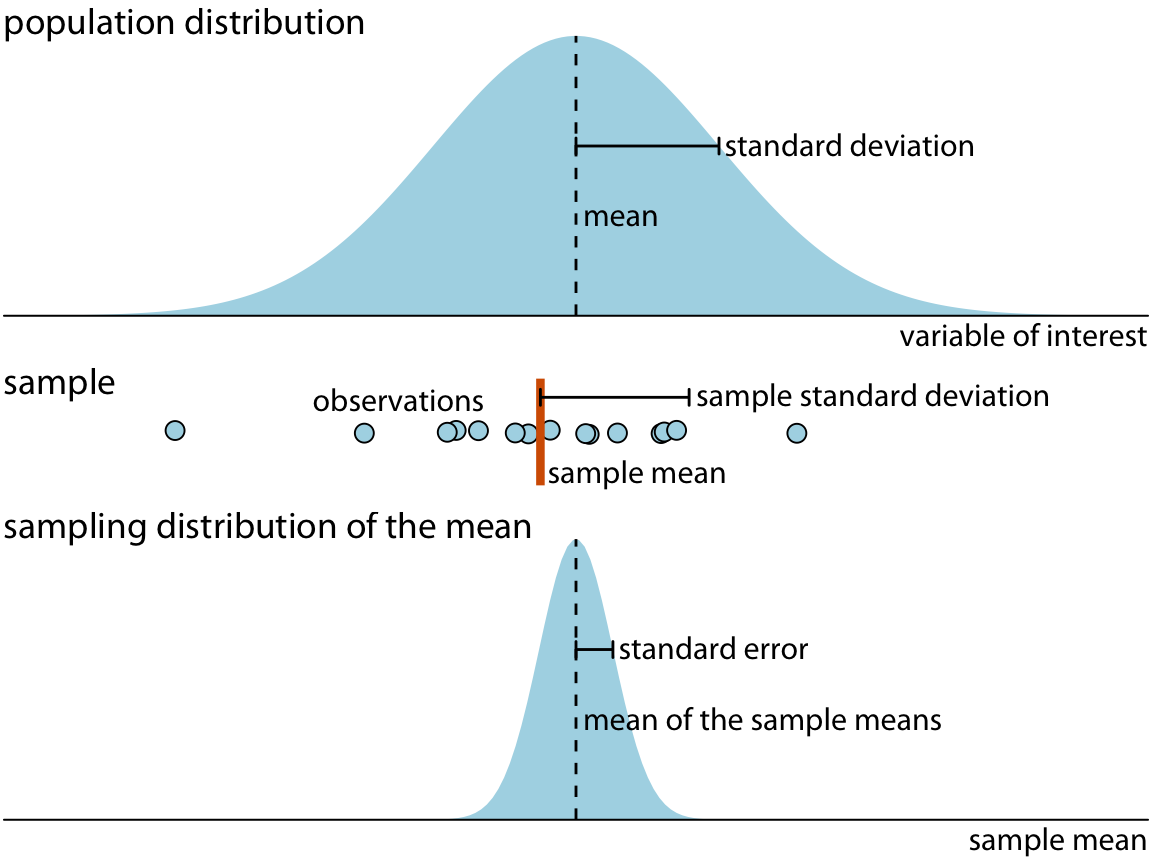
This schematic links the population distribution at the top, a single sample and its sample mean in the middle, and the sampling distribution of the mean at the bottom. It illustrates how repeated sampling produces a distribution of sample means and shows how the sample mean functions as a point estimate. The inclusion of standard deviation and standard error extends slightly beyond the subsubtopic but supports conceptual understanding. Source.
FAQ
A point estimate is calculated the same way as a descriptive statistic, but its purpose is different. A descriptive statistic summarises the sample itself, whereas a point estimate uses that same value to infer something about the wider population.
In other words, the distinction lies in interpretation rather than computation. The same numerical value can be purely descriptive or inferential depending on how it is used.
A point estimate provides a quick, interpretable summary that guides initial understanding of the population parameter. It is often the starting value for constructing more advanced inferential tools.
It is also useful when comparisons are needed, such as evaluating changes over time or differences between groups, even before uncertainty is quantified.
Sample size affects stability. Larger samples tend to produce more consistent point estimates because individual unusual values have less influence.
As sample size grows, the estimate becomes more representative of the underlying population behaviour, even though uncertainty is not explicitly calculated at this stage.
A sample proportion may be misleading when the category being measured is extremely rare or when the sample contains very few cases, making the estimate unstable.
It is also problematic when the sampling process systematically excludes certain groups, meaning the sample proportion does not reflect the true population structure.
Point estimates must be tied to the practical meaning of the variable measured. The same numerical value can imply very different real-world outcomes depending on units, population, and timeframe.
Clear reporting typically includes:
• What was measured
• Who or what the population is
• The units involved
• Any necessary contextual qualifiers to avoid misinterpretation
Practice Questions
Question 1 (1–3 marks)
A researcher collects a random sample of 40 adults from a town and records the number of hours each adult exercised in the previous week. The sample has a mean of 3.8 hours.
(a) Identify the point estimate in this context.
(b) State clearly the population parameter this point estimate is intended to estimate.
Question 1
(a) 1 mark
• Correct identification of the point estimate as the sample mean of 3.8 hours.
(b) 1–2 marks
• 1 mark for stating that it estimates the population mean number of hours of exercise per week.
• 2 marks if the answer clearly specifies it refers to all adults in the town.
Total: 2–3 marks depending on detail.
Question 2 (4–6 marks)
A company wants to estimate the average time customers spend on its website per visit. A simple random sample of 60 customer visits is taken, producing a sample mean of 5.4 minutes.
(a) Explain why the sample mean is used as the point estimate for the population mean.
(b) Describe two factors that could affect how well this point estimate reflects the true population mean.
(c) A manager claims that the sample mean proves that the population mean is exactly 5.4 minutes. Explain why this interpretation is inappropriate.
Question 2
(a) 1–2 marks
• 1 mark for stating that the sample mean summarises the sample data.
• An additional mark for explaining that the sample mean is the standard point estimator for the population mean.
(b) 2–3 marks
Award up to 3 marks for any two well-explained factors, such as:
• Representativeness of the sample (sampling method).
• Sample size and its effect on variability.
• Presence of outliers or skewness affecting the estimate.
• Measurement accuracy.
(c) 1 mark
• Correct explanation that a point estimate provides an approximate value and is subject to sampling variability, so it does not prove the exact value of the population mean.
Total: 4–6 marks depending on completeness and clarity.
