
AP Syllabus focus:
‘A small p-value (typically < 0.05) suggests that the observed data are unlikely under the null hypothesis, leading to the rejection of the null hypothesis in favor of the alternative.
- The specific threshold for "small" is determined by the significance level, α, chosen before the test.’
This section explains how p-values guide formal statistical decisions, emphasizing the role of the significance level (α) and how evidence from data determines whether to reject the null hypothesis.
Decision Making with p-Values
Statistical decision-making uses the relationship between the p-value and the significance level (α) to determine whether evidence from the sample is strong enough to reject the null hypothesis (H₀). Because the p-value quantifies the probability of observing data as extreme as what was collected if H₀ is true, it serves as a direct measure of the strength of evidence against H₀.
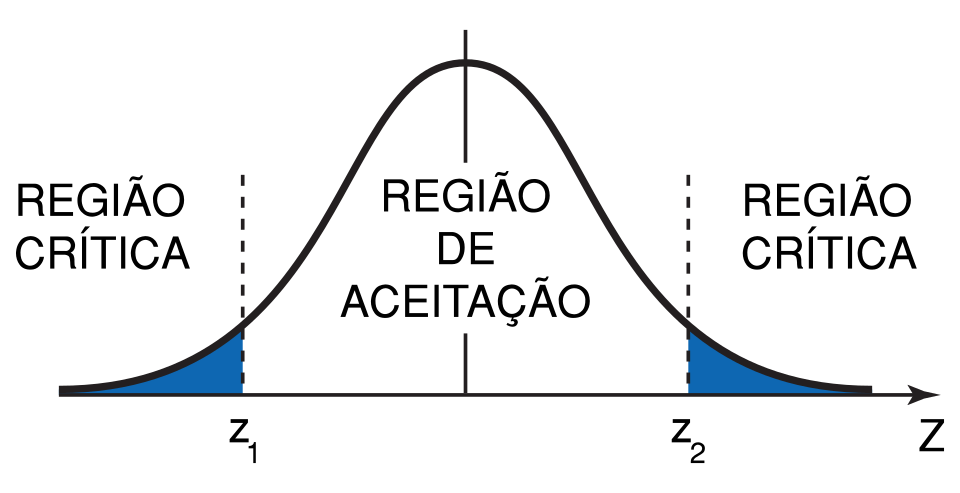
A normal distribution with a shaded critical region highlights how unlikely outcomes under the null model correspond to small p-values. The shaded area represents α, the threshold for rejecting the null hypothesis. Source.
Understanding the Role of the Significance Level
The significance level (α) is a researcher-selected threshold that defines how unlikely the sample results must be, under H₀, before rejecting the null hypothesis. Common choices such as α = 0.05 or α = 0.01 reflect tolerance for the risk of mistakenly rejecting a true null hypothesis. A smaller α indicates a more conservative stance on rejecting H₀, requiring stronger evidence.
Significance Level (α): The predetermined probability threshold used to decide whether a p-value is considered sufficiently small to reject the null hypothesis.
Statistical decisions rely on comparing these two values, where the p-value is interpreted relative to α rather than in isolation.
Comparing p-Values to α
The decision process depends directly on whether the p-value is less than, equal to, or greater than α. This comparison determines whether the observed data align with what would typically occur if H₀ were true.
If p-value ≤ α: Reject H₀ because the data are sufficiently unlikely under the null model.
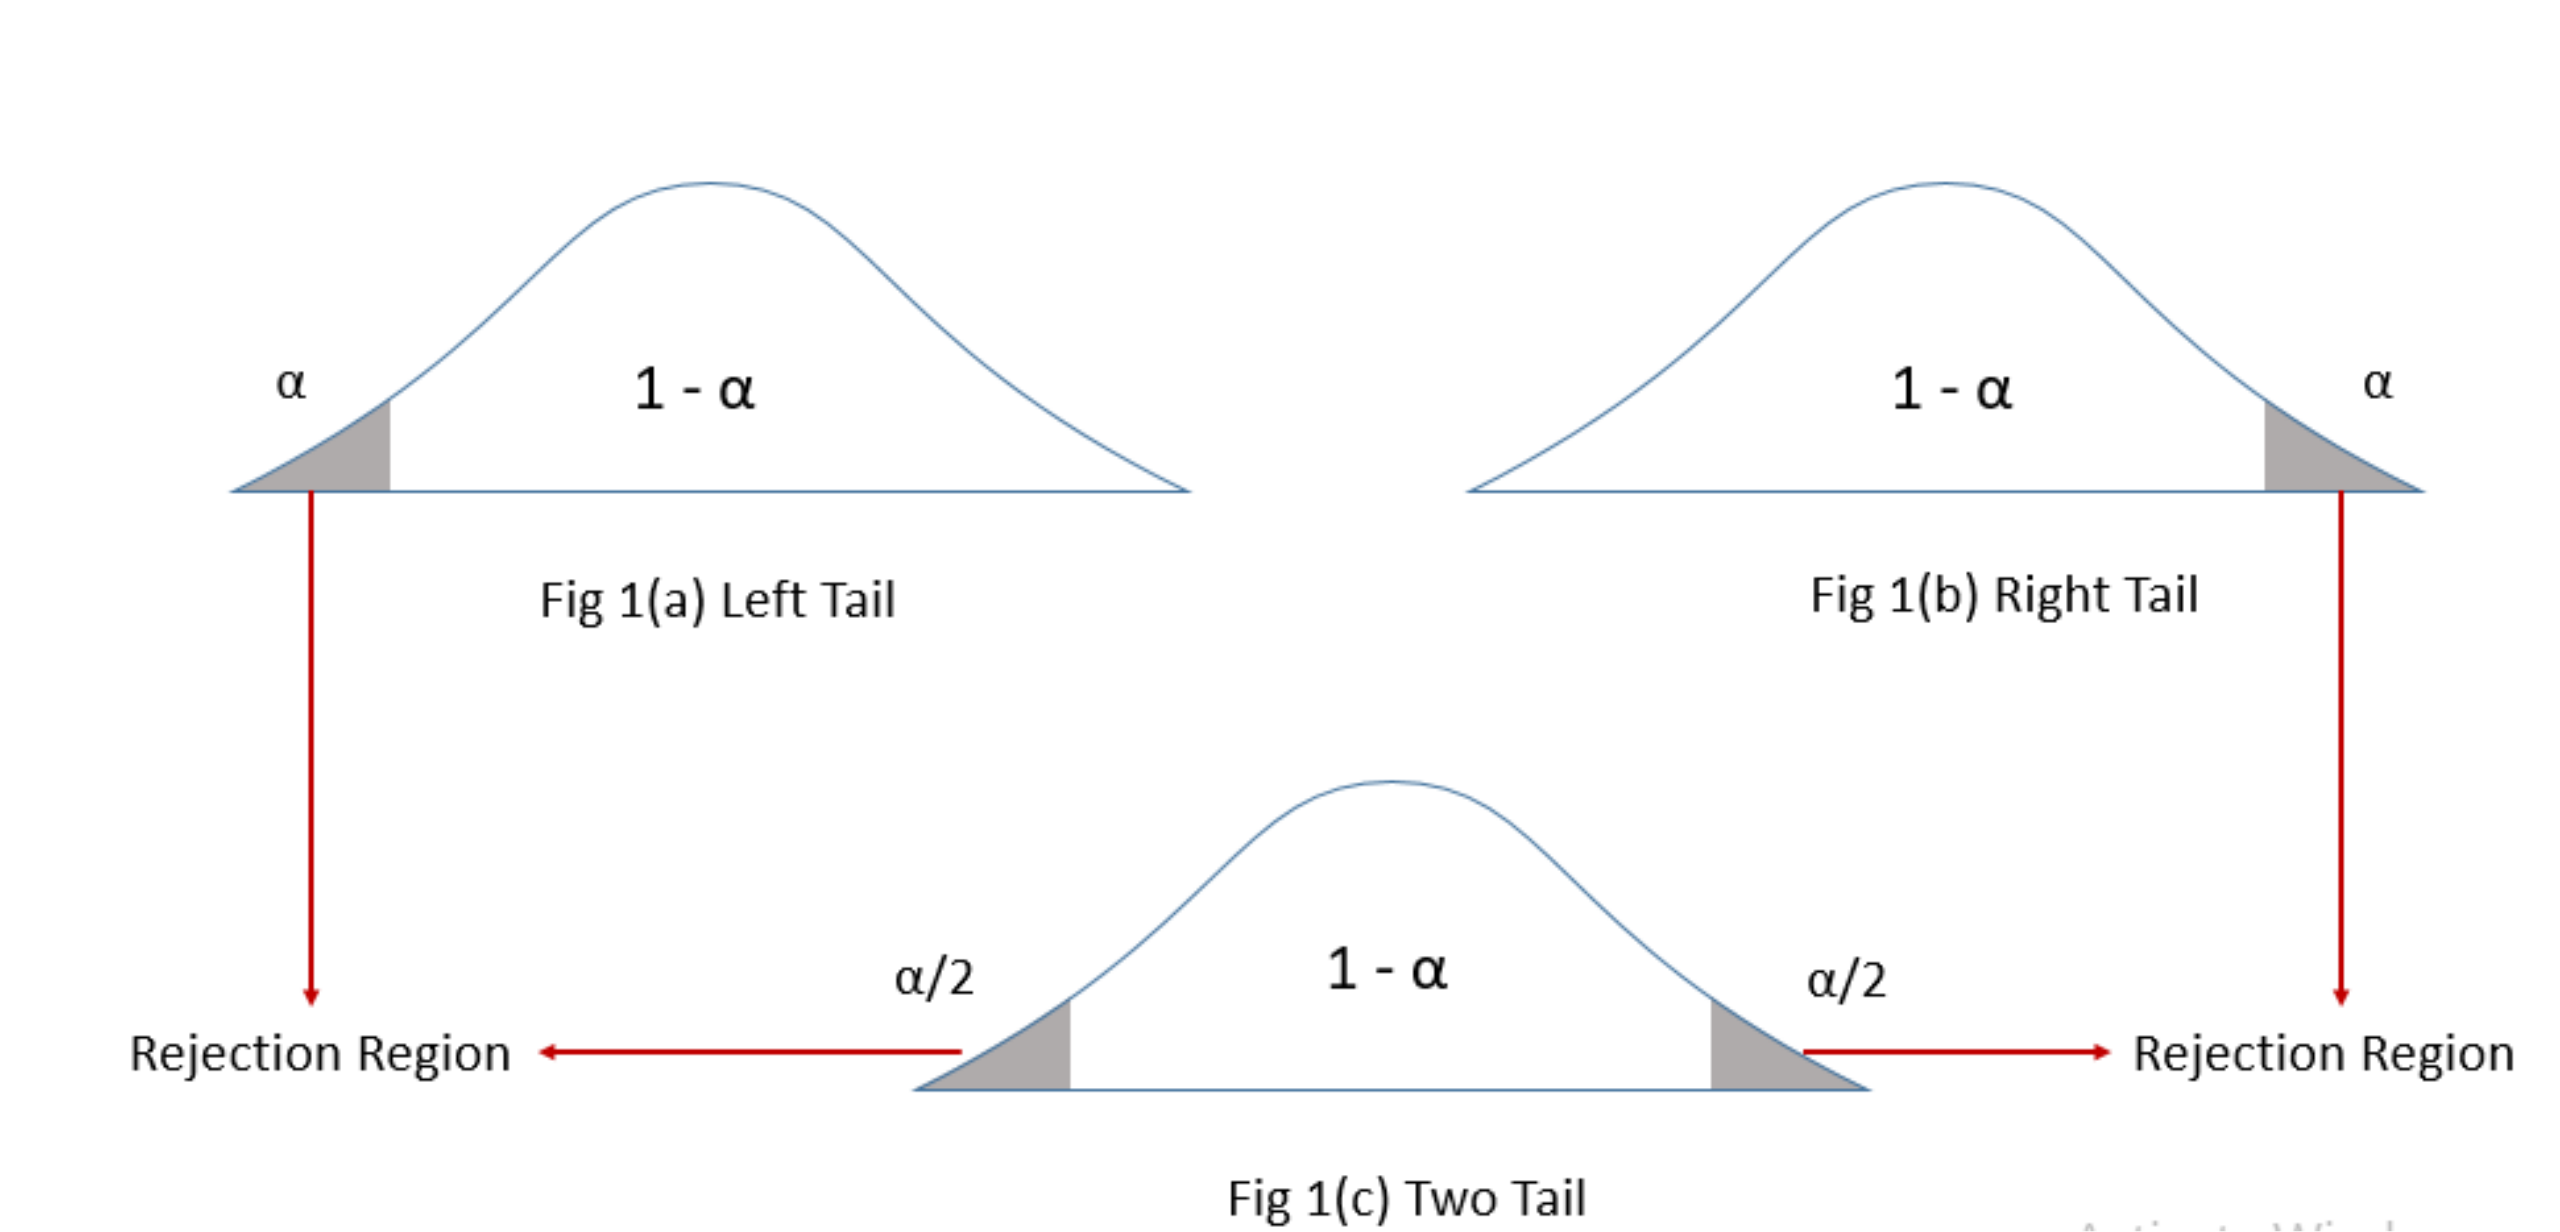
Rejection-region diagrams for left-, right-, and two-tailed tests illustrate how α determines which outcomes lead to rejecting H0H_0H0. Each shaded region corresponds to values that would yield p-values at or below α. Source.
If p-value > α: Fail to reject H₀ because the data are not unlikely enough to claim evidence against it.
Because hypothesis tests do not prove hypotheses, a failure to reject H₀ does not confirm it; instead, it indicates insufficient statistical evidence.
Interpreting Decision Outcomes
The interpretation of decisions must always remain rooted in the study’s context. Rejecting H₀ suggests that the alternative hypothesis (Hₐ) is better supported by the sample data. Failing to reject H₀ indicates that the evidence does not meet the required strength set by α. The p-value communicates degree of support, not certainty.
p-value: The probability, assuming the null hypothesis is true, of obtaining a test statistic at least as extreme as the one observed.
One sentence of normal text is required here before providing an equation block, ensuring conceptual continuity.
Linking p-Values to Statistical Evidence
Lower p-values provide stronger evidence against H₀ because they indicate that the observed data would rarely occur if the null hypothesis were true. The interpretation is not absolute; instead, it reflects how well the data align with the null model.
EQUATION
= A standardized measure (such as a z-value) comparing observed sample results to what would be expected under the null hypothesis
Researchers must therefore ensure the significance level is chosen before data collection. Selecting α post-analysis biases decisions and invalidates the statistical reasoning that underlies hypothesis testing.
Decision-Making Framework
Students should internalize the structured reasoning used in significance testing. The framework ensures consistency and transparency in how claims are supported by the statistical evidence provided by the p-value.
Follow this logical process:
Identify the research question and define H₀ and Hₐ clearly.
Select α in advance based on the context and acceptable risk level.
Compute the test statistic and resulting p-value using appropriate formulas.
Compare the p-value to α during the decision step.
Interpret the outcome in context, emphasizing evidence—not proof.
The decision based on the p-value ultimately determines how strongly the data contradict the null hypothesis. When the p-value falls below α, the data are regarded as sufficiently incompatible with H₀ to justify rejection. When it does not, the evidence is deemed too weak to support the alternative.
Using Context to Support Decisions
Hypothesis testing never occurs in isolation from real-world meaning. The significance level should reflect the consequences of errors, while the interpretation of the decision must explicitly connect back to the population and proportion under investigation. Clear communication of the reasoning—especially how the p-value supports or fails to support a claim—ensures that statistical conclusions are meaningful, responsible, and aligned with the AP Statistics curriculum.
FAQ
A p-value measures how inconsistent the sample data are with the null hypothesis, not the probability that the hypothesis itself is correct.
It focuses on the extremeness of the observed results assuming the null hypothesis is already true. A smaller p-value reflects stronger evidence against the null because such results would rarely occur under the null model.
Yes. A p-value is compared directly to the significance level, so choosing a stricter or more lenient level can change the decision.
For example:
• If the p-value is 0.04, it leads to rejection when alpha is 0.05 but not when alpha is 0.01.
• The evidence does not change, but the threshold for acting on it does.
Setting alpha before analysing data prevents biased or data-driven decisions.
If alpha were chosen after seeing the p-value, researchers could manipulate the threshold to justify rejecting the null hypothesis. This undermines the objectivity and replicability of inference, which is why pre-specifying alpha is a requirement in proper statistical testing.
The p-value is always calculated from tail areas, but the number and direction of tails depend on the alternative hypothesis.
• One-sided alternatives use a single tail.
• Two-sided alternatives combine both tails.
This means the same test statistic may yield different p-values under different alternatives, even with identical data.
Yes. Although it does not confirm that the null hypothesis is true, it signals that the sample data are reasonably consistent with it.
In practical settings, this can support maintaining existing policies or assumptions when no strong evidence suggests change. It also highlights the need to consider sample size and study design before drawing broader conclusions.
Practice Questions
Question 1 (1–3 marks)
A researcher tests a claim about a population proportion using a significance level of 0.05. The p-value from the sample data is 0.032.
a) State the decision the researcher should make about the null hypothesis.
b) Briefly explain the reasoning behind this decision in the context of p-values and significance levels.
Question 1
a) 1 mark
Correct decision: Reject the null hypothesis.
b) Up to 2 marks
1 mark for stating that the p-value is less than the significance level.
1 mark for explaining that the data are considered unlikely under the null hypothesis, providing evidence against it.
Total: 3 marks
Question 2 (4–6 marks)
A school claims that 60% of its students participate in at least one extracurricular activity. A random sample of students is taken, and a hypothesis test for the population proportion is conducted. The resulting p-value is 0.148, using a significance level of 0.05.
a) State whether the school’s claim should be rejected based on these results.
b) Explain what the p-value indicates about the compatibility of the sample data with the null hypothesis.
c) Interpret the decision in a contextual sentence appropriate for a formal conclusion in an AP Statistics hypothesis test.
Question 2
a) 1 mark
Correct decision: Fail to reject the null hypothesis.
b) Up to 3 marks
1 mark for stating that the p-value is greater than the significance level.
1 mark for explaining that the data are not sufficiently inconsistent with the null hypothesis.
1 mark for noting that there is not enough statistical evidence to support an alternative claim.
c) Up to 2 marks
1 mark for a contextual conclusion referencing the school’s population of students.
1 mark for correctly indicating that the evidence is insufficient to challenge the claim that 60% participate in an extracurricular activity.
Total: 6 marks
