
AP Syllabus focus:
‘The p-value provides a measure of the strength of the evidence against the null hypothesis. Lower p-values indicate stronger evidence against the null hypothesis, whereas higher p-values suggest weaker evidence. The interpretation of the p-value in the context of the research question allows researchers to make informed decisions about the validity of their hypotheses.’
A p-value’s size directly reflects how strongly sample data conflict with the null hypothesis, making it a central tool for interpreting evidence in statistical inference.
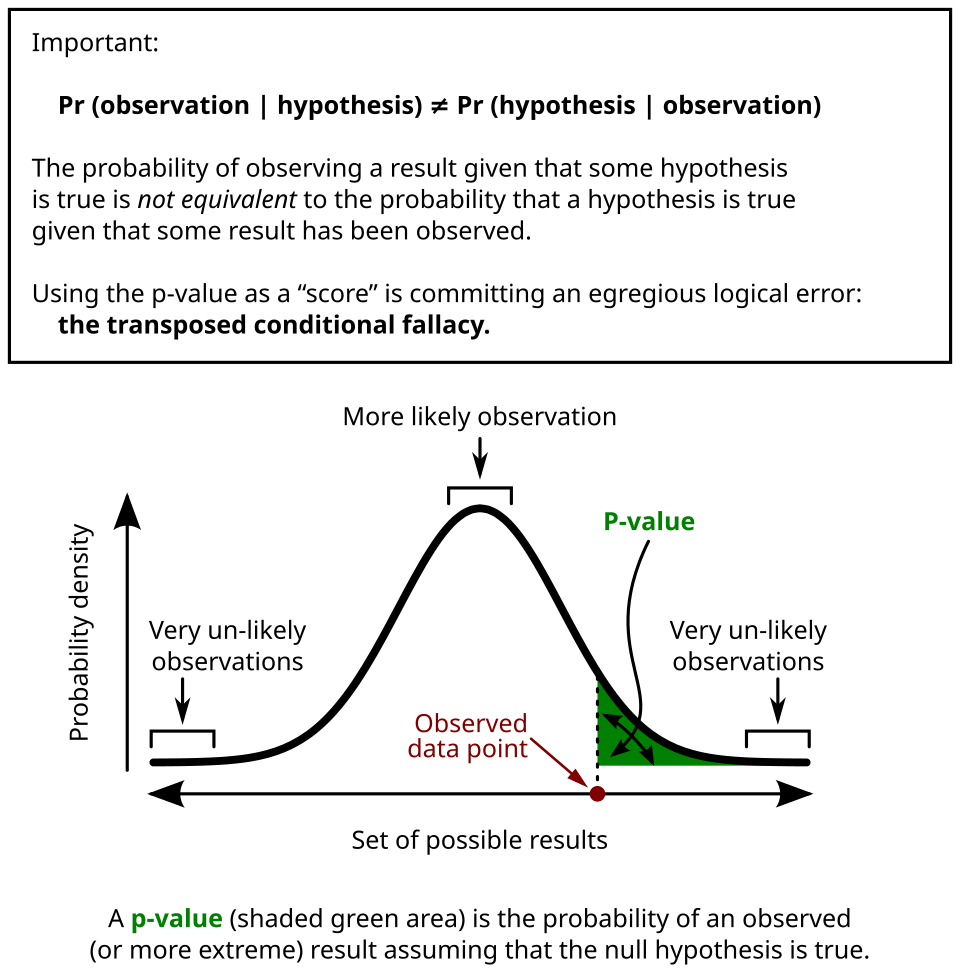
The diagram displays the sampling distribution under the null hypothesis, with the shaded tail representing the p-value and the cutoff marking the significance threshold. The shading highlights how extremeness is assessed relative to the null model. Some labels extend slightly beyond syllabus requirements but reinforce conceptual clarity. Source.
Understanding Evidence from p-Values
The relationship between p-values and statistical evidence is essential for interpreting results from significance tests. A p-value quantifies how surprising the observed sample would be if the null hypothesis were true. Smaller values signal stronger evidence against the null hypothesis because they indicate that the observed data, or something more extreme, would rarely occur under the assumed model. Larger p-values indicate weaker evidence, suggesting the data are reasonably consistent with the null hypothesis.
When analyzing results, it is important to connect the p-value to the specific context of the research question, ensuring that statistical findings translate meaningfully into claims about the population.
What the p-Value Measures
When a student first encounters a p-value, it is crucial to understand that it is not the probability that the null hypothesis is true. Instead, it is the probability of obtaining an outcome as extreme as the observed one, assuming the null hypothesis is correct. This conditional nature is fundamental to proper interpretation.
p-value: The probability of obtaining a test statistic at least as extreme as the observed value, assuming the null hypothesis is true.
Interpreting p-values requires recognizing that it is a measure of compatibility between the data and the null hypothesis model rather than a direct measure of truth.
Strength of Evidence and Directionality
The degree to which the p-value contradicts the null hypothesis depends on how small it is relative to the significance level, but the p-value itself provides graded evidence:

The illustration compares the observed p-value with the significance level α, showing how the decision threshold and evidence strength relate. The labeled α-region denotes the maximum tolerated probability of a Type I error. The Type I error labeling slightly exceeds the syllabus scope but supports understanding of how evidence is judged. Source.
Very small p-values (e.g., below 0.01) indicate that the sample data are highly inconsistent with the null hypothesis.
Moderately small p-values (e.g., between 0.01 and 0.05) suggest substantial evidence against the null hypothesis.
Large p-values (e.g., above 0.10) imply that the data are not unusual under the null hypothesis and provide weak evidence against it.
The direction of the alternative hypothesis shapes how extremeness is calculated, but the general relationship between p-value size and evidential strength remains consistent.
Interpreting Evidence in Context
Statistical evidence only becomes meaningful when framed within the research scenario. Analysts must relate the p-value back to the population parameter and the specific question motivating the test. This contextualization prevents overgeneralization and encourages appropriate conclusions that reflect uncertainty.
A normal sentence here ensures spacing before definitions or equations when needed.
Statistical evidence: Information from sample data used to evaluate the plausibility of a hypothesis about a population parameter.
Because p-values quantify evidence rather than prove hypotheses, students should learn to interpret them as part of a broader inferential framework rather than as standalone verdicts.
How p-Values Guide Inference
To translate p-values into decision-making and reasoning, consider the following roles they play in analysis:
Assessing Compatibility with the Null Hypothesis
A p-value indicates how compatible the sample is with the null hypothesis model. Smaller p-values imply lower compatibility and thus stronger evidence against the null hypothesis. This relationship is central to the syllabus emphasis that p-values provide a measure of the strength of evidence.
Supporting Claims
A p-value helps determine whether the sample offers compelling evidence for the alternative hypothesis. Claims should be justified by:
Referencing the observed level of evidence
Discussing how strongly the data deviate from expectations under the null hypothesis
Connecting the interpretive conclusion to the real-world context of the problem
Distinguishing Statistical and Practical Evidence
While a small p-value may indicate statistical significance, it does not necessarily imply practical importance. Students must critically evaluate how the statistical evidence relates to the substantive question of interest.
Relating Evidence Strength to Research Questions
Because the p-value communicates the degree of evidence against the null hypothesis, researchers use it to justify or question claims. A careful interpretation should include:
The meaning of “extreme results” in the test context
The assumptions under which the p-value was calculated
How the p-value informs, but does not determine, the validity of the research claim
Bullet points can help clarify common interpretive principles:
Lower p-value → stronger evidence against the null hypothesis
Higher p-value → weaker evidence, suggesting data are consistent with the null hypothesis
Evidence must always be interpreted in context, never in isolation
p-values measure evidence, not certainty or probability of hypotheses
By understanding the link between p-values and evidence, students learn to ground their statistical conclusions in the logic of inference and to communicate results responsibly and clearly.
FAQ
The p-value measures how extreme the observed statistic is, relative to what would be expected under the null hypothesis. The definition of “extreme” changes depending on whether the test is one-sided or two-sided.
In a one-sided test, only outcomes in the direction of the alternative hypothesis count as evidence.
In a two-sided test, outcomes in both tails contribute, making p-values larger for the same test statistic.
A smaller p-value indicates stronger statistical evidence, but very large samples can produce extremely small p-values even for trivial differences.
Large samples make it easier to detect tiny deviations from the null hypothesis, so evidence may be statistically strong but practically insignificant.
This highlights the importance of considering effect size alongside p-values.
Greater variability makes it harder to detect differences, often resulting in larger p-values.
Lower variability supports more precise estimates, meaning even modest departures from the null hypothesis may appear statistically compelling.
Thus variability shapes the strength of evidence by influencing how clearly the data deviate from the null model.
Yes. Context affects evidence interpretation.
• A p-value must be understood relative to the research setting, measurement precision, and sampling design.
• A p-value of 0.04 may be compelling in a high-variability environment but less informative when multiple comparisons are made or when prior expectations differ.
The p-value alone cannot capture all the nuances of evidential strength.
P-values are calculated assuming the null hypothesis is true, so they cannot quantify its probability.
They measure how well the data align with the null model, not the likelihood of the hypothesis itself.
Because they do not incorporate prior information or alternative explanations, p-values are evidence indicators rather than probability statements about hypotheses.
Practice Questions
A researcher conducts a significance test for a population proportion and obtains a p-value of 0.42. What does this p-value indicate about the strength of evidence against the null hypothesis?
1 mark: States that a p-value of 0.42 indicates weak or no evidence against the null hypothesis.
1 mark: Explains that such a large p-value suggests the sample data are reasonably consistent with the null hypothesis.
A study investigates whether the proportion of customers who prefer a new product differs from 0.60. A random sample is taken, and the resulting test yields a very small p-value.
(a) Explain what a very small p-value indicates in the context of the study.
(b) Discuss how the p-value should be interpreted in relation to the null hypothesis and the research question.
(c) Explain why a small p-value does not prove that the alternative hypothesis is true.
(a)
1 mark: States that a very small p-value indicates strong evidence against the null hypothesis.
1 mark: Mentions that the observed sample result would be highly unlikely if the true proportion were 0.60.
(b)
1 mark: Explains that the null hypothesis becomes less plausible when the p-value is small.
1 mark: Links interpretation to the context (customer preference for the new product).
1 mark: States that the result supports the alternative hypothesis within the limits of sampling variation.
(c)
1 mark: States that a small p-value does not prove the alternative hypothesis; it only provides evidence against the null.
1 mark: Explains that p-values measure compatibility with the null hypothesis, not the probability that a hypothesis is true.
