
AP Syllabus focus:
‘Understanding that C% of confidence intervals will contain the true difference in population proportions when drawn from repeated random sampling of the same size. - Interpretation of confidence intervals must include context from the samples taken and the populations they represent, ensuring that the inference made is relevant and correctly framed within the scope of the data.’
Confidence intervals for the difference between two population proportions offer a structured way to quantify uncertainty and express plausible values for a population parameter.
Understanding the Interpretation of a Confidence Interval
Interpreting a confidence interval for the difference between two population proportions requires recognizing how random sampling and repeated sampling behavior shape statistical inference. A confidence interval communicates uncertainty, helping researchers determine whether the data provide convincing evidence of a population-level difference.
The Role of Repeated Sampling
A key idea behind confidence intervals is their long-run performance when the sampling process is repeated many times under identical conditions. The confidence level, C%, represents the proportion of those intervals that would successfully capture the true difference in population proportions over an infinite number of repeated random samples of the same size.
Confidence Level: The long-run proportion of confidence intervals, constructed using the same method, that will contain the true parameter if sampling were repeated many times.
This repeated-sampling interpretation reflects the randomness of sample outcomes and the natural variability of sample statistics such as .
In repeated random sampling, about C% of all such intervals would capture the true difference between the population proportions, while the remaining (100 − C)% would miss it.
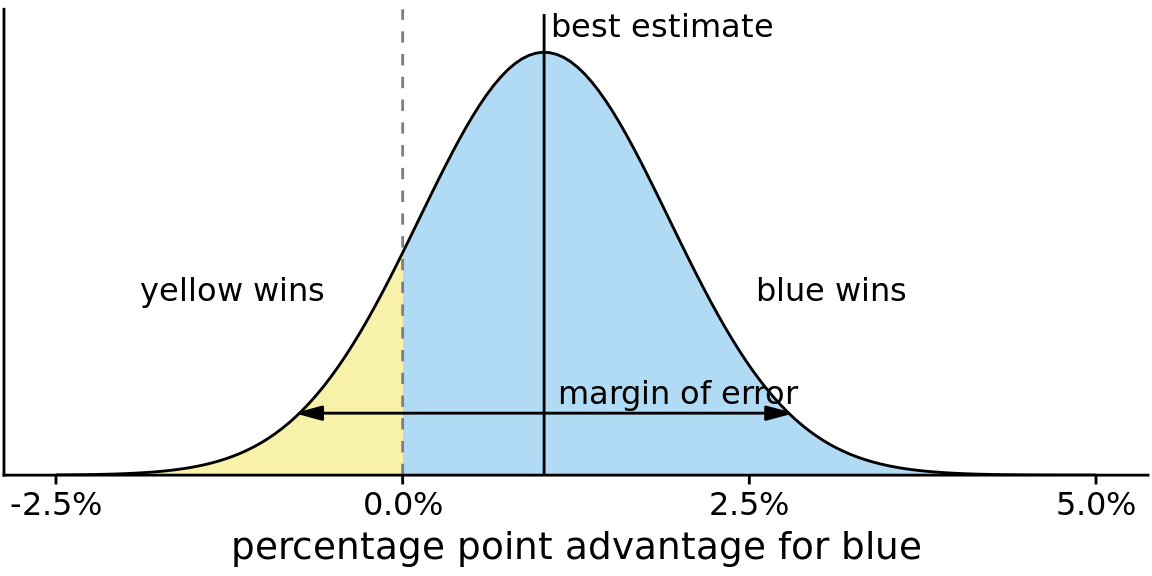
This figure visualizes how repeated samples generate many confidence intervals, most of which contain the true parameter while a few miss it. Although illustrated for a mean, the same repeated-sampling interpretation applies to confidence intervals for differences in population proportions. Source.
What a Confidence Interval Does and Does Not Mean
A common misconception is that a C% confidence interval gives the probability that the true parameter lies within the computed interval. The true difference between population proportions is fixed, not random, while the interval varies from sample to sample. Thus, the correct interpretation focuses on the method’s reliability, not the probability of a particular interval being correct.
Connecting Interpretation to Context
A statistically meaningful interpretation must explicitly reference the populations and sampling process. Without context, a confidence interval loses its substantive meaning. When describing an interval:
Identify the two populations being compared.
Refer to the sample data used to construct the interval.
Explain what the interval suggests about the difference in population proportions.
A context-rich interpretation might note whether the interval includes 0, which helps indicate whether the data provide evidence of a real difference between populations.
Importance of Sample Representation
Because confidence intervals rely on sampling variability, their interpretation depends on whether the sample accurately represents the population. This connection emphasizes why researchers must describe who was sampled and how the data were collected.
Sampling Variability: The natural variation in a statistic, such as , that arises because different random samples from the same population produce different results.
Recognizing sampling variability strengthens understanding of why confidence intervals differ across studies yet remain reliable in the long run.
Interpreting Long-Run Capture Rates
A C% confidence interval does not guarantee that the single interval obtained from one study contains the true difference. Instead, it communicates the capture rate of the method when used repeatedly.
EQUATION
= Sample proportions for populations 1 and 2
= Sample sizes
= Critical value corresponding to the chosen confidence level
A confidence interval is thus best understood as a range of plausible values for the population difference based on the observed sample. Whether it captures the true parameter cannot be determined from a single interval, but the method’s performance over time justifies its reliability.
A C% confidence interval for p₁ − p₂ is a range of plausible values for the true difference between the population proportions, centered at the observed difference in sample proportions.
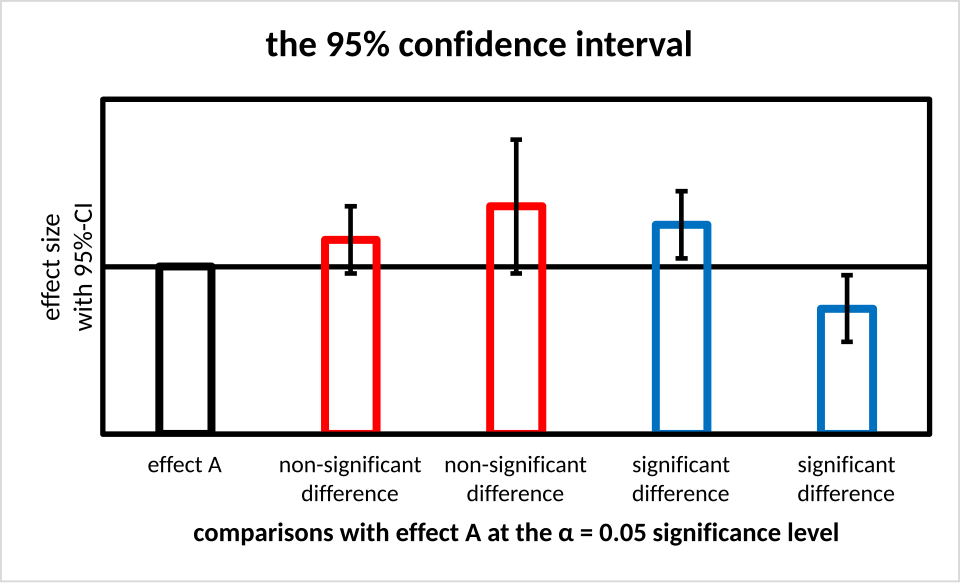
This chart depicts point estimates with attached 95% confidence intervals, illustrating how an interval expresses a plausible range of values around an estimate. Though shown for generic parameters, the same structure applies to interpreting confidence intervals for the difference between two population proportions. Source.
Framing Interpretations Appropriately
When communicating results, clear statements grounded in context help ensure accurate understanding. Interpretations should:
Reference the confidence level and what it implies about repeated sampling.
State the interval as a range of plausible values for the difference in population proportions.
Connect the interpretation to the real-world research question.
Avoid probabilistic statements about the single computed interval.
Bullet points reinforce the essential aspects of interpretation:
A C% interval reflects long-run method success, not probability for one interval.
Intervals must be interpreted in the context of the specific samples and populations.
The interval provides evidence about whether the true difference might be positive, negative, or zero.
Inclusion or exclusion of 0 helps assess whether the data suggest a meaningful population difference.
Understanding confidence interval interpretation equips students to evaluate research findings responsibly and recognize the role statistical uncertainty plays in comparing population proportions.
FAQ
A confidence interval reflects uncertainty because the sample statistic varies from sample to sample. The interval provides a set of values that are consistent with the observed data, not a definitive statement about the true difference.
This approach recognises that any single interval may or may not contain the population difference, but the method is designed to perform reliably across repeated sampling.
A narrower interval suggests greater precision, allowing stronger statements about whether the true difference is likely positive, negative, or close to zero.
A wider interval indicates more uncertainty and makes it harder to draw clear conclusions, even if the point estimate suggests a substantial difference.
No. Interpretation must explicitly refer to the two populations being compared because the meaning of the interval depends entirely on the context of the study.
Without identifying the populations, the interpretation becomes vague and may be misapplied to settings the data do not represent.
A wholly negative interval indicates that the sample data are consistent with population proportion p1 being lower than p2.
• If the interval does not contain zero, this suggests statistical evidence of a true difference in that direction.
• The magnitude of the negative values indicates the plausible size of that difference.
Different valid methods (for example, normal approximation or adjusted intervals) may produce slightly different endpoints, but all share the same conceptual interpretation: a range of plausible values for the population difference.
The interpretation depends on the inferential framework rather than the computational formula, as long as the method’s assumptions are reasonably met.
Practice Questions
Question 1 (1–3 marks)
A researcher constructs a 95% confidence interval for the difference in population proportions (p1 - p2) and obtains the interval (-0.04, 0.12).
Explain, in context, what this interval means.
Question 1
• 1 mark for stating that the interval gives a range of plausible values for the true difference in population proportions.
• 1 mark for correctly noting that the interval includes 0 and therefore does not provide strong evidence of a real difference between the populations.
• 1 mark for explicitly interpreting in context (must refer to the specific populations or groups in the study).
Question 2 (4–6 marks)
A study compares two independent groups to estimate the difference in population proportions, p1 - p2. A 90% confidence interval for the difference is calculated as (0.06, 0.18).
a) Interpret the confidence interval in the context of the study.
b) Based on the interval, state whether the data provide evidence that p1 exceeds p2. Justify your answer.
c) Explain what the phrase “90% confidence” means in terms of repeated sampling.
Question 2
a) (2 marks)
• 1 mark for stating that the true difference in population proportions is plausibly between 0.06 and 0.18.
• 1 mark for contextual interpretation referring to the two populations or groups.
b) (1–2 marks)
• 1 mark for stating that the interval provides evidence that p1 exceeds p2 because all values in the interval are positive.
• 1 mark for noting that 0 is not included, supporting the conclusion of a positive difference.
c) (1–2 marks)
• 1 mark for explaining that 90% confidence refers to the long-run success rate of the method if sampling were repeated many times.
• 1 mark for stating that approximately 90% of intervals constructed in this way would contain the true difference in population proportions.
