
AP Syllabus focus:
‘Translate the confidence interval into interval estimates with specific units of measurement. This step involves presenting the confidence interval in the context of the original data to provide a practical interpretation of the results.’
A confidence interval becomes meaningful only when its numerical bounds are translated into clear, contextual statements. Interval estimates express statistical results using real-world units and interpretation.
Understanding Interval Estimates
An interval estimate is a contextualized statement that communicates what the calculated confidence interval suggests about the population parameter. It transforms the abstract numerical interval into language that directly relates to the study setting. Interval estimates do not add new calculations; instead, they articulate the meaning of the interval bounds using the original measurement scale.
Interval Estimate: A contextualized interpretation of a confidence interval that translates its numerical bounds into meaningful statements about the population parameter.
Because confidence intervals represent ranges of plausible values for a population proportion, an interval estimate must reflect this uncertainty while grounding the interpretation in the study’s population and variable.
Connecting Numerical Bounds to Context
After constructing the confidence interval for the difference of two population proportions, , students must express what the interval implies in practical terms. The emphasis is on translating statistical notation into clear, interpretable language.
EQUATION
= Sample proportions for populations 1 and 2
= Sample sizes
= Critical value corresponding to the chosen confidence level
The interval estimate explicitly communicates the meaning of the upper and lower bounds using the variable being measured. This translation is essential because statistical conclusions must be understandable to audiences without mathematical expertise.
Written numerically, the confidence interval becomes the interval estimate: a lower bound and an upper bound that bracket plausible values for the true difference in population proportions.
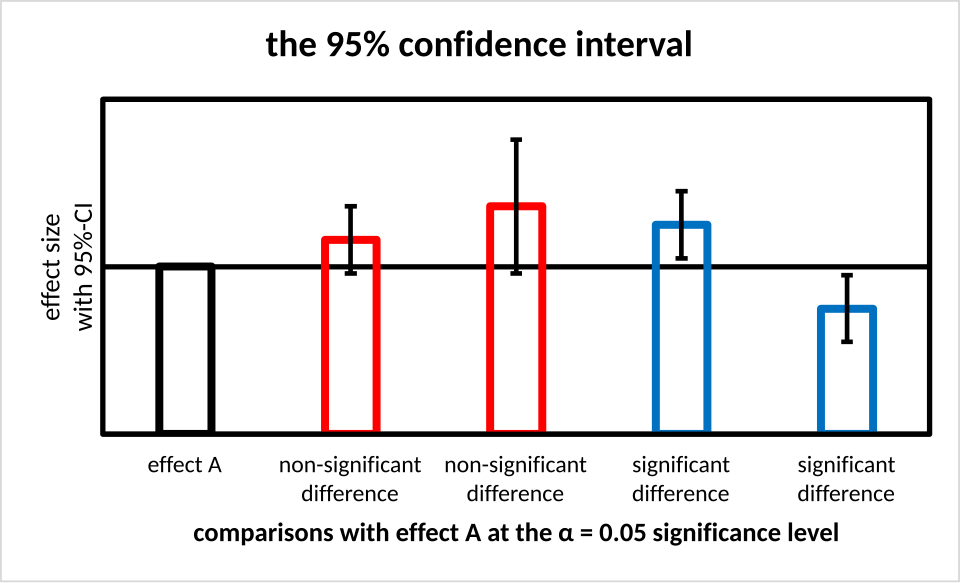
Bar chart illustrating several sample estimates with their associated 95% confidence intervals drawn as vertical error bars. Each error bar shows the lower and upper endpoints of the interval estimate around a point estimate. Although shown for means, the visual structure of an interval estimate is identical to that used for proportions. Source.
Key Elements of Effective Interval Estimates
An effective interval estimate incorporates several essential features that ensure clarity and alignment with AP expectations.
1. Reference to the Population
An interval estimate must specify the populations represented by the two sample proportions. It is incorrect to state interpretations solely in terms of the samples because confidence intervals always generalize from sample data to broader populations.
2. Description of the Variable
The interval must be tied to the category or event being measured. Because we are dealing with population proportions, the statement should identify the categorical outcome of interest and its meaning within context.
3. Presentation in Original Units
Proportions are naturally unitless, but their interpretation often relates to meaningful descriptors of group differences. When appropriate, interval estimates may be expressed as absolute differences in proportions, percentage-point differences, or directional comparisons.
4. Connection to Confidence Level
Although interval estimates focus on translating bounds, they remain grounded in the logic of C% confidence. This phrase conveys that the method—rather than a specific interval—captures the parameter in roughly C% of repeated samples.
Even though we report only one interval estimate in a study, the confidence level describes what would happen if we repeatedly took similar samples and built new confidence intervals each time.
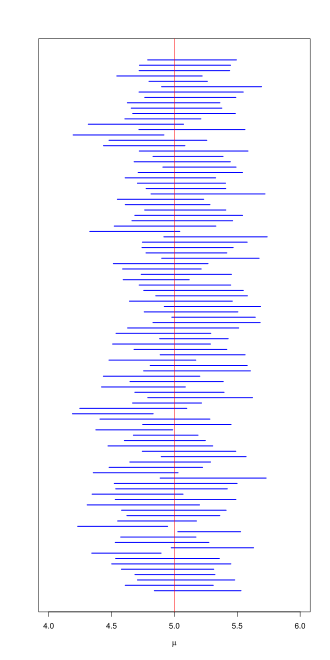
Plot of 100 separate 95% confidence intervals drawn from repeated random samples, with a vertical red line marking the true parameter value. Most intervals cross the true value, visually demonstrating the long-run coverage interpretation of a confidence level. Although based on means, the concept mirrors how confidence intervals function for differences in proportions. Source.
5. Expression of Uncertainty
Interval estimates must avoid definitive claims. Instead, they emphasize plausible values, using language such as:
“likely lies between”
“is estimated to fall within”
“is consistent with values from ___ to ___”
Process for Constructing Interval Estimates
Students can rely on a structured approach to produce coherent interpretations.
Step 1: Identify the Parameter
State that the confidence interval estimates the difference in population proportions. Clarify which population corresponds to and which corresponds to .
Step 2: Relate Bounds to Real-World Meaning
Translate each endpoint of the interval into the context of the categorical variable. This ensures that the interpretation never drifts into generic numerical description.
Step 3: Use Clear, Non-Technical Language
Even though the calculations rely on formulas, the final interval estimate must be readable and accessible. This is especially important when interval estimates appear in research settings or applied contexts.
Step 4: Preserve Directionality
The order must remain explicit in the interpretation. Reversing direction can lead to incorrect claims about which population has a higher or lower proportion.
Step 5: Maintain Statistical Integrity
Avoid conclusions that imply certainty. Interval estimates should always acknowledge the inherent randomness of sample-based inference.
Practical Characteristics of Interval Estimates
Well-crafted interval estimates exhibit several recognizable strengths:
They anchor interpretation in the confidence interval while reframing it into applied meaning.
They avoid excessive precision by refraining from over-interpreting boundary values.
They communicate implications for population differences without implying causation.
They focus on what the interval suggests about plausible differences, not on what it proves.
Importance of Contextual Translation
AP Statistics emphasizes that meaningful interpretation is as critical as correct computation. The specification requires that students “present the confidence interval in the context of the original data.” This translation step ensures that statistical results function as tools for reasoning about real-world situations, not merely mathematical outputs. Interval estimates bridge the gap between numerical inference and applied understanding, reinforcing the purpose of confidence intervals in statistical analysis.
FAQ
Precision depends on the context and audience. For technical readers, specifying the interval to two or three decimal places is common, but for public communication, rounding to whole percentage points is usually clearer.
Overly precise values can falsely imply certainty, so the key is balancing clarity with accuracy.
Yes. An interval estimate can help assess practical importance by showing whether the entire interval contains differences large enough to matter in context.
If the entire interval suggests only very small differences, the result may be statistically precise but practically trivial.
Avoid statements that imply certainty, such as “the true difference is definitely within this range”.
Also avoid phrasing that attributes confidence to the specific interval rather than the method, such as “we are 95% sure this interval contains the true value”.
Clear alternatives include “the interval suggests” or “the difference is likely between”.
Use simple, direct phrasing linked to the context and avoid statistical jargon.
Helpful strategies include:
• expressing differences in percentage points
• clarifying which group is higher or lower
• briefly stating the confidence level without technical explanation
If an interval extends into implausible territory (for example, below −1 or above 1 for differences in proportions), the issue usually arises from small samples or extreme sample proportions.
Options include:
• reporting the computed interval but noting its limits
• using adjusted methods that constrain bounds to feasible values
• collecting larger or more balanced samples to improve stability
Practice Questions
Question 1 (1–3 marks)
A researcher constructs a 95% confidence interval for the difference in population proportions (p1 − p2) and obtains the interval −0.12 to −0.04.
Using this interval, write an appropriate interval estimate in context, explaining what the bounds imply about the difference between the two population proportions.
Mark scheme:
• 1 mark for stating that the interval provides a range of plausible values for the difference between the population proportions.
• 1 mark for interpreting the negative bounds as evidence that population 1 has a lower proportion than population 2.
• 1 mark for correctly describing this difference in contextual terms (e.g., the proportion in population 1 is estimated to be between 4 and 12 percentage points lower than population 2).
Question 2 (4–6 marks)
A public health team compares the proportion of adults meeting daily exercise recommendations in two cities. A 90% confidence interval for p1 − p2 (City A minus City B) is calculated as 0.03 to 0.11.
(a) Produce an interval estimate explaining what this interval suggests about the true difference in population proportions.
(b) Explain how this interpretation depends on the confidence level and how the interval estimate should be communicated to a general audience.
Mark scheme:
• 1 mark for identifying that the interval suggests the true difference in proportions lies between 0.03 and 0.11.
• 1 mark for interpreting the interval in context (City A likely has a higher proportion of adults meeting exercise recommendations).
• 1 mark for noting that all plausible values are positive, indicating consistent evidence of a higher proportion in City A.
• 1 mark for explaining that a 90% confidence level means that the method captures the true difference in 90% of repeated samples.
• 1 mark for describing that the interval estimate expresses uncertainty rather than certainty, using appropriate phrasing such as “likely lies between”.
• 1 mark for describing how the interpretation should be framed for a general audience (avoiding technical terms, presenting the range clearly, and emphasising it applies to the population rather than only the sample).
