
AP Syllabus focus:
‘Recognize that random variation in data collection and analysis can lead to errors in statistical inference. This includes understanding the types of errors (Type I and Type II) and their probabilities.
- Discuss the implications of these errors and the importance of considering them when making conclusions from statistical analyses.’
Random variation occurs naturally in data and can cause statistical conclusions to differ from reality. Understanding how this randomness leads to inference errors is essential for sound decision-making.
Understanding Random Variation in Statistical Inference
Random variation refers to the unpredictable fluctuations that occur when data are collected from a population. Because every sample differs, statistical estimates vary, which makes inference inherently uncertain. Recognizing how this uncertainty produces mistakes in hypothesis testing is central to evaluating the reliability of conclusions.
When random variation affects sample outcomes, it can mislead analysts into thinking an effect exists when it does not, or missing an effect that truly exists. These possibilities form the basis of formal inferential error types, each carrying different consequences for interpretation. Considering the probabilities of these errors is critical whenever conclusions are drawn from sample data rather than full population information.
Sampling Variability and Its Role in Error
Sampling variability describes how sample statistics differ from sample to sample.
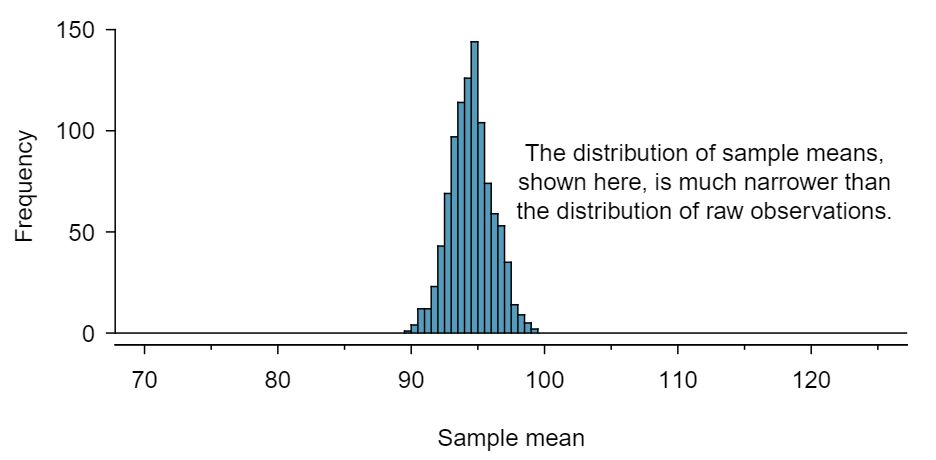
Histogram illustrating sampling variability across repeated samples; the spread of sample means shows how randomness contributes to uncertainty in inference. Source.
It is a fundamental reason why errors occur in inference because statistical procedures rely on sample evidence to estimate unknown parameters. Even under perfect data collection, two samples of equal size from the same population are unlikely to produce identical results.
Sampling Variability: The natural fluctuation in sample statistics that occurs because each random sample captures different individuals from the population.
Researchers must therefore evaluate the strength of evidence provided by the sample while acknowledging that randomness may distort the observed results. This awareness is especially important when interpreting borderline outcomes from hypothesis tests.
Types of Errors in Statistical Inference
Hypothesis tests involve decisions based on sample evidence, and random variation creates two distinct error possibilities.
Type I Error: Rejecting a true null hypothesis, meaning the inference incorrectly suggests an effect exists.
A Type I error is often described as a “false positive.” Its probability, denoted α, is chosen by the researcher as the significance level. This probability reflects the long-run frequency with which a correct null hypothesis would be rejected under repeated sampling.
A different mistake arises when the test fails to detect an actual effect.
Type II Error: Failing to reject a false null hypothesis, meaning the inference misses a real effect.
The probability of a Type II error is denoted β, and it depends on factors such as sample size, effect size, and inherent variability.
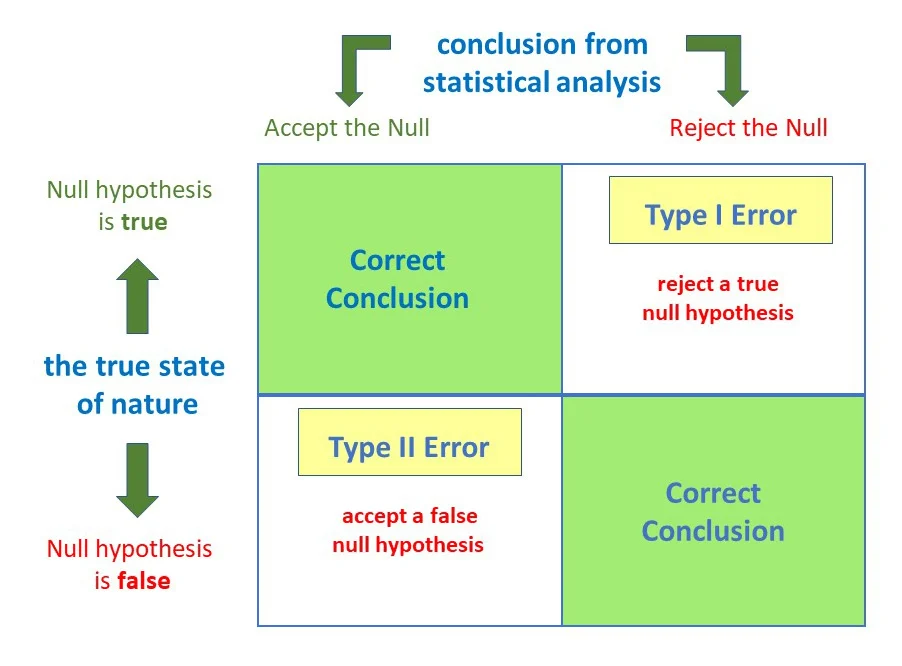
Matrix showing the four possible outcomes of hypothesis testing, clearly distinguishing correct decisions from Type I and Type II errors. Source.
These two errors move in opposite directions; reducing the chance of one typically increases the chance of the other.
Probabilities of Error and Their Interpretation
Understanding the probabilities of Type I and Type II errors enables researchers to evaluate the risks associated with inferential decisions. Because α is set before data collection, it provides a clear threshold for assessing evidence. A smaller α reduces the chance of falsely declaring a significant result but makes it harder to detect real differences. Meanwhile, β is rarely predetermined, yet its complement—power, defined as —represents the probability of correctly rejecting a false null hypothesis.
Although students are not required to compute β or power for basic AP Statistics work, the conceptual link between these probabilities and error risk is essential. Recognizing that any test outcome involves uncertainty helps prevent overconfident interpretations of significance results.
Implications of Inferential Errors
Inferential errors have meaningful consequences depending on the context. A Type I error may lead to adopting an ineffective policy, approving a faulty product, or reaching an incorrect scientific conclusion. A Type II error may allow real problems to go undetected or lead researchers to overlook important relationships. Because the impact of each error type differs across scenarios, analysts must evaluate which mistake carries greater cost and adjust significance levels or study design accordingly.
Bullet-point considerations illustrate why thoughtful interpretation is vital:
Type I errors risk acting on results driven by random variation rather than true effects.
Type II errors risk inaction when real differences or relationships exist.
Choosing α involves balancing caution against sensitivity.
Understanding β helps frame the limitations of the evidence.
Importance of Accounting for Random Variation
Recognizing that sample outcomes vary is crucial when making conclusions from statistical analyses. Even when correct procedures are followed, randomness may lead to sample results that misrepresent the underlying population. Therefore, researchers must:
Evaluate the strength of the evidence relative to potential error risks.
Avoid overstating certainty, especially near decision thresholds.
Consider study design choices—such as sample size—to reduce the likelihood of errors.
By integrating awareness of random variation and its consequences, analysts can produce more reliable and responsible interpretations grounded in statistical reasoning.
FAQ
The probability of a Type I error is controlled by choosing a significance level before analysing the data. Researchers typically select 0.05, 0.01, or another value that reflects how cautious they want to be.
Once this level is chosen, the procedure ensures that, in the long run, no more than that proportion of tests will incorrectly reject a true null hypothesis.
The probability of a Type II error depends on factors that are often unknown, such as the true difference between the population mean and the hypothesised value.
It also varies with sample size, population variability, and the chosen significance level, making it dependent on multiple components rather than a single fixed value.
No single design decision minimises both errors simultaneously, but some strategies help manage the trade-off:
• Increasing sample size reduces variability and lowers the probability of Type II errors.
• Using random sampling and careful data collection minimises bias, helping ensure valid inference.
• Choosing an appropriate significance level balances the risks of false positives and false negatives.
Borderline p-values are especially sensitive to sampling variation because small shifts in the data can push the test statistic slightly above or below the rejection threshold.
Such instability means that repeated samples from the same population could easily produce different decisions, even when the underlying truth does not change.
The seriousness of a Type I or Type II error varies widely across applications. In some settings, a false positive carries greater risk; in others, a false negative is more harmful.
Context determines:
• Which error type is more costly.
• Whether stricter significance levels are justified.
• How evidence should be communicated to reflect uncertainty responsibly.
Practice Questions
Question 1 (1–3 marks)
A researcher conducts a hypothesis test using a small random sample. The null hypothesis is actually true, but the test results lead the researcher to reject it.
(a) Identify the type of error that has occurred.
(b) Briefly explain why random variation in the sample can lead to this error.
Question 1 Mark Scheme (1–3 marks)
(a) 1 mark
• Identifies the error as a Type I error.
(b) 1–2 marks
• States that random variation in the sample may cause the test statistic to appear more extreme than expected under the true null hypothesis (1 mark).
• Explains that this can lead to incorrect rejection of the null hypothesis because sample results do not perfectly reflect the population (1 additional mark).
Total: 3 marks
Question 2 (4–6 marks)
A study investigates whether a new revision method improves students’ average test scores. The researchers test the null hypothesis that the mean score for students using the method is equal to the standard mean score. The alternative hypothesis states that the method increases the mean score.
During the analysis, the researchers express concern about the probabilities of making a Type I or Type II error.
(a) Define both a Type I error and a Type II error in this context.
(b) State one consequence of making a Type I error for this study.
(c) State one consequence of making a Type II error for this study.
(d) Explain why increasing the sample size can reduce the risk of making a Type II error.
Question 2 Mark Scheme (4–6 marks)
(a) 2 marks
• Type I error: Concluding that the new revision method increases the mean score when it actually does not (1 mark).
• Type II error: Failing to detect that the method genuinely increases the mean score when it truly does (1 mark).
(b) 1 mark
• States a relevant consequence, e.g. schools may adopt a method that is not genuinely effective, leading to wasted resources or misplaced confidence.
(c) 1 mark
• States a relevant consequence, e.g. the method may be dismissed even though it works, causing students to miss out on a beneficial improvement.
(d) 1–2 marks
• States that larger samples reduce variability in sample statistics or produce more precise estimates (1 mark).
• Explains that this precision increases the chance of detecting a real effect when one exists, thereby reducing the probability of a Type II error (1 additional mark).
Total: 6 marks
