
AP Syllabus focus:
‘Use the results of the significance test to support a claim about the population. The conclusion must be stated in context, relating the statistical findings to the research question and explaining what the decision about the null hypothesis implies for the populations being studied.’
This section explains how to justify a claim after a significance test for two population proportions by connecting statistical decisions to real-world research questions.
Understanding the Role of Claims in Significance Testing
Justifying a claim after conducting a significance test for the difference of two population proportions requires interpreting the statistical decision in the context of the research question. The goal is to move beyond numerical results and explain what the decision about the null hypothesis means for the populations being studied. Because claims influence conclusions drawn from data, it is essential to clearly connect the test’s outcome to the practical situation motivating the study.
Linking Test Decisions to Claims
A statistical test yields either a rejection or a failure to reject the null hypothesis, and each outcome guides how claims should be supported. The null hypothesis represents no difference between the population proportions, while the alternative hypothesis represents the claim being tested. When presenting results, students must articulate how the statistical evidence aligns with or fails to support the investigated claim.
Evidence From the p-Value
The p-value serves as a central piece of information when defending a claim. It quantifies the likelihood of observing the sample difference or something more extreme if the null hypothesis were true.
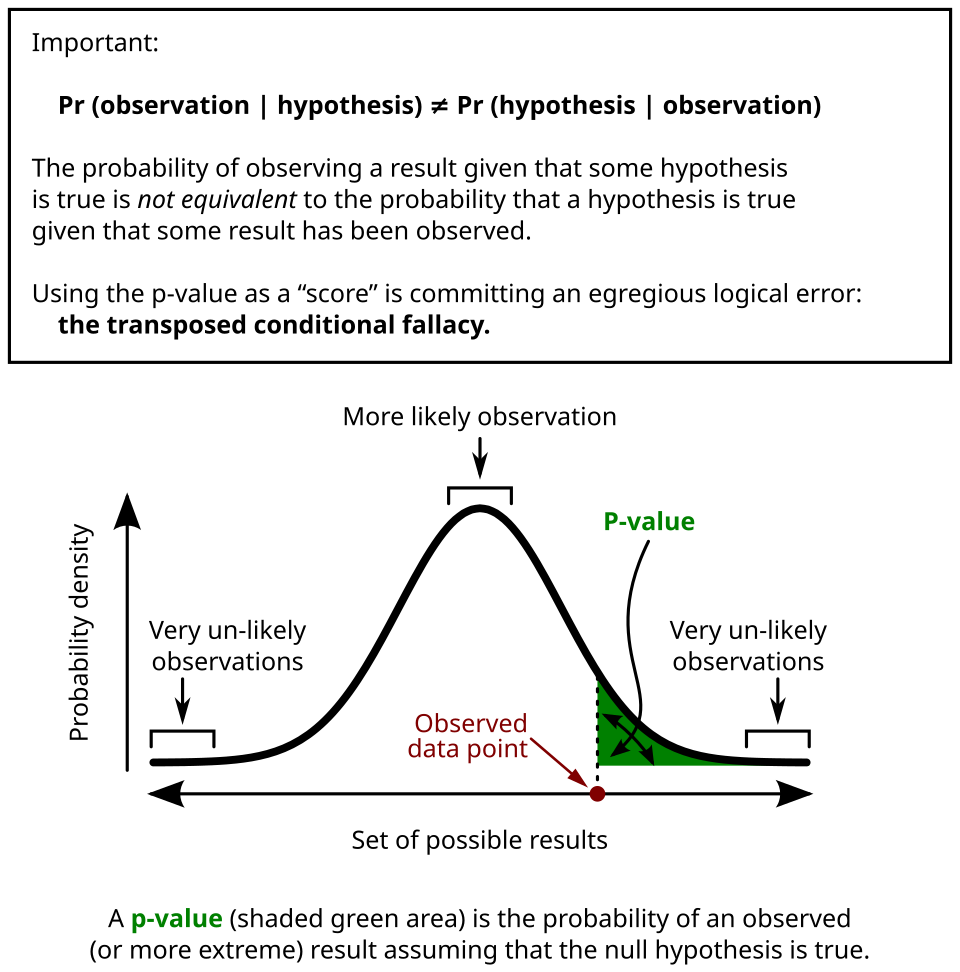
This diagram illustrates the p-value as the shaded tail area under the distribution assuming the null hypothesis is true, highlighting how extreme the observed statistic is relative to that distribution. Source.
p-Value: The probability of obtaining a test statistic as extreme as or more extreme than the observed result, assuming the null hypothesis is true.
When using the p-value to justify a claim, students must discuss whether the evidence is statistically convincing at the chosen significance level, which determines the threshold for rejecting the null hypothesis.
Connecting Statistical Results to Context
A valid justification always incorporates context from the study. The statistical decision alone is insufficient; the reasoning must reference the populations represented by the sample data. When determining whether the test results support a claim, it is crucial to specify the direction and nature of the difference implied by the alternative hypothesis and relate it back to the subject matter of the research question. Without contextual interpretation, the claim lacks meaningful grounding.
Structuring a Claim Justification
A high-quality justification integrates statistical reasoning and contextual interpretation in a logical manner. Students should present information clearly and support claims systematically.
Essential Components of a Claim Justification
Restatement of the research question to anchor the interpretation.
Identification of the statistical decision, noting whether the null hypothesis is rejected or not.
Discussion of the p-value and how it compares to the significance level.
Explanation of what the decision means for the populations, stated in clear, contextual language.
Articulation of whether the statistical evidence supports the claim, avoiding overstatements about proving the hypothesis.
A justification must avoid implying certainty. Significance testing provides evidence, not proof, and claims must reflect this probabilistic nature.
Statistical Logic Behind Supporting a Claim
When the test leads to rejection of the null hypothesis, the sample data are considered inconsistent with no difference between the population proportions.
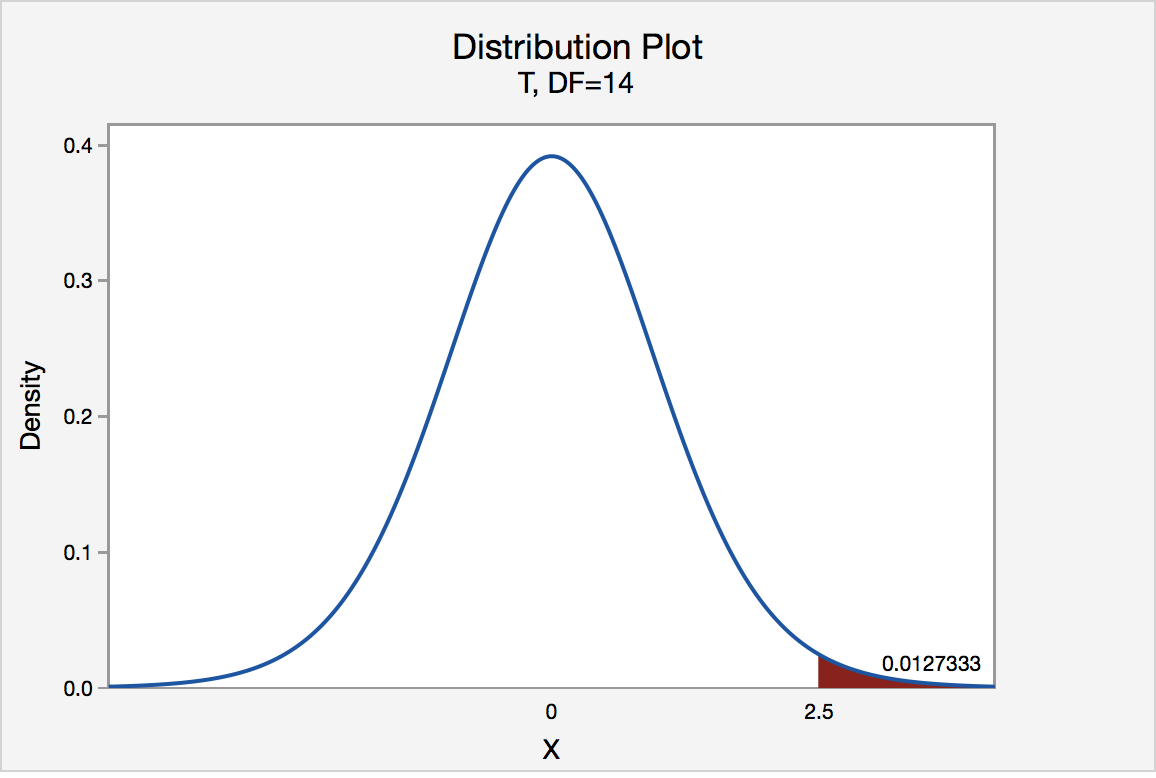
This plot shows a right-tailed test where the shaded region represents the p-value, demonstrating how tail probability is used to evaluate evidence against the null hypothesis. Although the example uses a t-distribution, the same principle applies to z-tests for proportions. Source.
This inconsistency provides statistical evidence in favor of the alternative hypothesis. Therefore, a claim aligned with the alternative hypothesis can be supported by stating that the observed difference is unlikely to be due to random sampling variation alone at the chosen significance level.
When the test fails to reject the null hypothesis, the justification changes. The evidence is not strong enough to conclude that the population proportions differ. However, this outcome does not validate the null hypothesis; instead, it indicates a lack of convincing evidence for the claim represented by the alternative hypothesis.
Interpreting the Implications for Populations
A strong justification highlights what the statistical findings imply about the underlying populations. Because the test is built on sample data, students must clearly distinguish between sample outcomes and population inferences. Claims should be expressed in terms such as “there is evidence that” or “there is not sufficient evidence to conclude,” which convey the tentative, evidence-based nature of statistical reasoning.
Avoiding Misinterpretations When Justifying Claims
Several common pitfalls can weaken a justification. Students must avoid equating a large p-value with proof that the population proportions are equal or implying that rejection guarantees the alternative hypothesis is true. Additionally, justifications should not describe the p-value as the probability that the null hypothesis is correct. Instead, explanations must focus on what the p-value indicates about the plausibility of the observed sample results under the assumption of the null hypothesis.
Key Practices for Effective Claim Support
Use precise statistical language that reflects uncertainty appropriately.
Refer explicitly to population proportions, not just sample values.
Connect each statistical step back to the research context and the stated claim.
Present reasoning that is logically consistent with the test results and the structure of hypothesis testing.
By centering the interpretation on context, statistical evidence, and sound reasoning, students can convincingly justify claims based on the results of a significance test for the difference between two population proportions.
FAQ
Contextual statements should be specific enough to show how the statistical conclusion relates to the real populations being studied, but concise enough to avoid unnecessary narrative detail.
A strong contextual statement:
Mentions the population groups represented by each sample.
Describes the direction or nature of the claim about the difference.
Avoids repeating numerical results unless directly relevant.
Many students mistakenly interpret the p-value as the probability that the null hypothesis is true.
Correct interpretation involves:
Understanding that the p-value quantifies how unusual the data are under the null model.
Using it to judge evidence strength, not truth status.
Explaining the result by focusing on the data’s extremity rather than the hypothesis’s plausibility.
Use language that reflects uncertainty rather than certainty.
Useful phrasing includes:
“There is evidence that…” rather than “This proves that…”.
“The data suggest…” rather than “The data show definitively…”.
Avoid claiming the alternative hypothesis is true; infer only that the data support it at the chosen significance threshold.
The alternative hypothesis determines which outcomes count as “more extreme,” and therefore shapes both the p-value and the interpretation of results.
Including direction clarifies:
What pattern of difference the test sought to detect.
How the observed data align with that pattern.
Whether the claim being justified matches the structure of the test performed.
Occasionally, a non-significant result may still suggest a practically meaningful difference, especially with small samples.
A clear justification should:
State the statistical conclusion accurately.
Acknowledge any practical considerations separately.
Clarify that the test did not find sufficient evidence, even if the observed difference might matter in real-world settings.
Practice Questions
Question 1 (1–3 marks)
A researcher conducts a significance test for the difference between two population proportions and obtains a p-value of 0.012 at the 5% significance level.
Explain whether the researcher can justify the claim that the two population proportions differ, and refer to the context of significance testing in your explanation.
Question 1 (1–3 marks)
1 mark for stating that the null hypothesis would be rejected because the p-value is less than the significance level.
1 mark for stating that there is statistical evidence that the population proportions differ.
1 mark for explaining that the claim is justified because such a difference would be unlikely to occur by chance if the true proportions were equal, referring to the context of significance testing.
Question 2 (4–6 marks)
A public health team tests whether the proportion of adults who receive a flu vaccine differs between two neighbouring cities. A significance test comparing the two sample proportions results in a p-value of 0.087 at the 5% significance level.
(a) State the formal decision regarding the null hypothesis.
(b) Explain whether the data provide statistical evidence to support the claim that the vaccination rates in the two cities differ.
(c) Justify your explanation in the context of the populations being studied, clearly linking your reasoning to the results of the significance test.
Question 2 (4–6 marks)
1 mark (part a) for correctly stating: fail to reject the null hypothesis, as the p-value is greater than the significance level.
1 mark (part b) for stating that there is not sufficient statistical evidence to support the claim that the proportions differ.
1–2 marks (part c) for explaining that the observed difference could reasonably be due to random sampling variation, since the p-value indicates that results this extreme are not unusual under the assumption of equal population proportions.
1–2 marks (part c) for explicitly placing the conclusion in context by referring to the populations (adults in the two cities), and correctly emphasising that failing to reject the null hypothesis does not prove the proportions are equal.
Total: 4–6 marks depending on the accuracy, clarity, and contextual completeness of the justification.
