
AQA Specification focus:
‘Production possibility diagrams illustrate different features of the fundamental economic problem, such as: resource allocation, opportunity cost and trade-offs, unemployment of economic resources, economic growth.’
Economic production possibility frontiers (PPFs) are a powerful visual tool for illustrating scarcity, efficiency, and economic potential, helping to analyse choices and trade-offs faced by economies.
Understanding the Production Possibility Frontier (PPF)
The Production Possibility Frontier (also called a Production Possibility Curve, PPC) is a diagram showing the maximum possible output combinations of two goods or services that an economy can produce when all resources are fully and efficiently employed.
Production Possibility Frontier (PPF): A curve showing the maximum potential combinations of goods or services an economy can produce with given resources and technology.
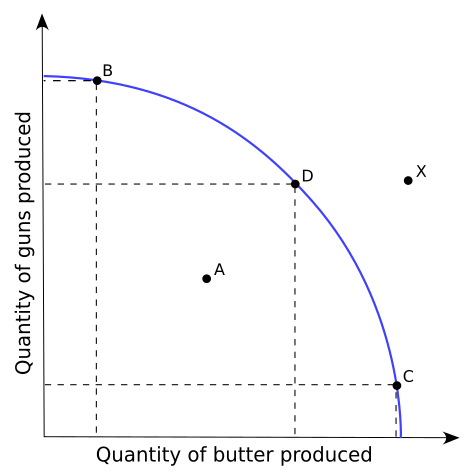
This diagram depicts the PPF for "guns" and "butter," highlighting points of efficiency (on the curve) and underutilisation (inside the curve), demonstrating the fundamental economic problem of scarcity. Source
A PPF assumes:
All resources are fully employed.
Resources are used efficiently.
The quantity and quality of resources are fixed in the short run.
Technology remains constant.
Resource Allocation on the PPF
Resource allocation refers to how an economy distributes its scarce resources between different goods and services.
Points on the curve show full employment and productive efficiency.
Points inside the curve represent underutilisation of resources.
Points outside the curve are unattainable with current resources and technology.
An economy’s position on its PPF reflects the current allocation of resources between competing uses. Moving along the curve requires reallocation of resources from one good to another, involving trade-offs.
Opportunity Cost
Opportunity cost is a key concept demonstrated by the PPF.
Opportunity Cost: The value of the next best alternative foregone when a choice is made.
When moving from one point on the PPF to another, the opportunity cost is the amount of one good that must be sacrificed to produce more of the other. The curve’s concave shape (bowed outward) reflects increasing opportunity cost due to the law of diminishing returns — resources are not equally efficient in producing all goods.
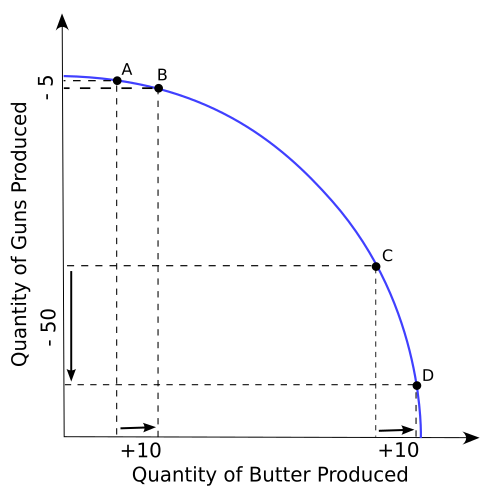
This diagram illustrates the opportunity costs associated with reallocating resources between two goods, exemplifying the trade-offs and increasing opportunity costs as production shifts along the PPF. Source
Trade-offs
A trade-off occurs when producing more of one good means producing less of another due to resource scarcity. The PPF captures this by illustrating all possible combinations and the sacrifices involved.
Trade-offs in economics involve:
Production choices — allocating more resources to capital goods vs. consumer goods.
Policy priorities — investing in defence vs. healthcare.
Short-run vs. long-run goals — immediate consumption vs. future economic growth.
Understanding trade-offs helps policymakers and businesses balance competing objectives.
Unemployment and the PPF
Unemployment of economic resources is illustrated by any point inside the PPF. This indicates that not all resources (labour, land, capital, enterprise) are being used productively.
Causes of such underutilisation can include:
High unemployment rates.
Idle capital due to low demand.
Inefficient production processes.
An economy can move from an interior point to the PPF boundary by increasing resource utilisation, often through policies promoting job creation and productivity.
Economic Growth and the PPF
Economic growth can be shown by an outward shift of the PPF. This represents an increase in the economy’s productive capacity.
Economic Growth: An increase in the economy’s potential output over time, shown by an outward shift of the PPF.
Factors causing outward shifts:
Increase in the quantity of resources (e.g., labour force growth).
Improvements in the quality of resources (e.g., education, training).
Technological progress boosting productivity.
Investment in capital goods.
Conversely, a inward shift indicates a fall in productive capacity, possibly due to natural disasters, war, or depletion of resources.
Key Features Illustrated by the PPF
1. Resource Allocation
Shows how resources are assigned between competing goods.
Highlights the need to make choices in a world of scarcity.
2. Opportunity Cost
Moving along the curve demonstrates the trade-off between goods.
The slope of the PPF at any point represents the marginal opportunity cost.
3. Trade-offs
The curve illustrates the sacrifices required to obtain more of one good.
Policymakers weigh trade-offs when deciding on production priorities.
4. Unemployment
Points inside the curve reveal underutilisation of resources.
Policy measures can shift the economy back to the PPF boundary.
5. Economic Growth
Outward shifts represent increased production possibilities.
Growth allows economies to produce more of all goods.
Analytical Uses of the PPF
The PPF is used in economic analysis to:
Evaluate efficiency and resource use.
Illustrate the effects of economic policies.
Analyse the impact of external shocks.
Demonstrate the trade-off between current consumption and future growth.
By combining these concepts, the PPF remains central to understanding the fundamental economic problem: scarce resources, unlimited wants, and the necessity of choice.
Practice Questions
Define the term opportunity cost and explain how it is shown on a production possibility frontier (PPF). (2 marks)
1 mark for correctly defining opportunity cost (e.g., the value of the next best alternative foregone when a choice is made).
1 mark for explaining that it is shown on a PPF by the amount of one good that must be given up to produce more of another good.
Using a production possibility frontier (PPF) diagram, explain how an economy can move from a position of unemployment of resources to full employment, and discuss the potential impact on opportunity cost and trade-offs. (6 marks)
Up to 2 marks for an accurate PPF diagram showing a point inside the frontier (unemployment) and a point on the frontier (full employment).
1 mark for explaining that movement from inside the curve to the frontier represents increased utilisation of resources.
1 mark for linking this movement to reduced unemployment of factors such as labour and capital.
1 mark for explaining that opportunity cost exists when moving along the curve, as producing more of one good requires producing less of another.
1 mark for discussing trade-offs — highlighting that full employment means resources are fully allocated, so producing more of one good necessitates reducing the output of another.
FAQ
A PPF is usually drawn as concave to the origin because resources are not equally suited to producing all goods. As production of one good increases, resources less efficient at making it must be diverted from producing the other good.
This results in increasing opportunity cost for each extra unit produced, a pattern consistent with the law of diminishing returns.
A straight-line PPF indicates constant opportunity cost — each additional unit of one good always requires the same sacrifice of the other good.
This would only occur if resources are perfectly adaptable for producing both goods, which is rare in reality.
Permanent outward shifts come from long-term increases in productive capacity, such as:
Advances in technology
Growth in the labour force
Better education and training improving productivity
Discovery of new natural resources
These shifts allow more of both goods to be produced without sacrificing one for the other.
Persistent underemployment, recession, or structural inefficiencies can cause prolonged operation inside the PPF.
Examples include:
High cyclical unemployment
Underused capital equipment
Mismatches between workers’ skills and job requirements
Allocating more resources to capital goods in the short term may reduce current consumption, representing an opportunity cost.
However, greater capital stock increases future productive capacity, potentially shifting the PPF outwards more significantly over time.
