
AQA Specification focus:
‘Why all points on the boundary are productively efficient but not all points on the boundary are allocatively efficient; students should be able to use production possibility diagrams to illustrate these features.’
The concept of efficiency on the Production Possibility Frontier (PPF) is central to understanding how economies use scarce resources, differentiating between productive efficiency and allocative efficiency.
Understanding Efficiency on the PPF
The PPF represents the maximum possible output combinations of two goods or services that an economy can achieve using all resources fully and efficiently, given current technology. Efficiency is assessed in two distinct ways: productive efficiency and allocative efficiency.
Productive Efficiency
Productive Efficiency: When it is impossible to produce more of one good without producing less of another, meaning all resources are fully and efficiently utilised.
Every point on the PPF curve (the boundary) is productively efficient because all available resources are being used to their full capacity.
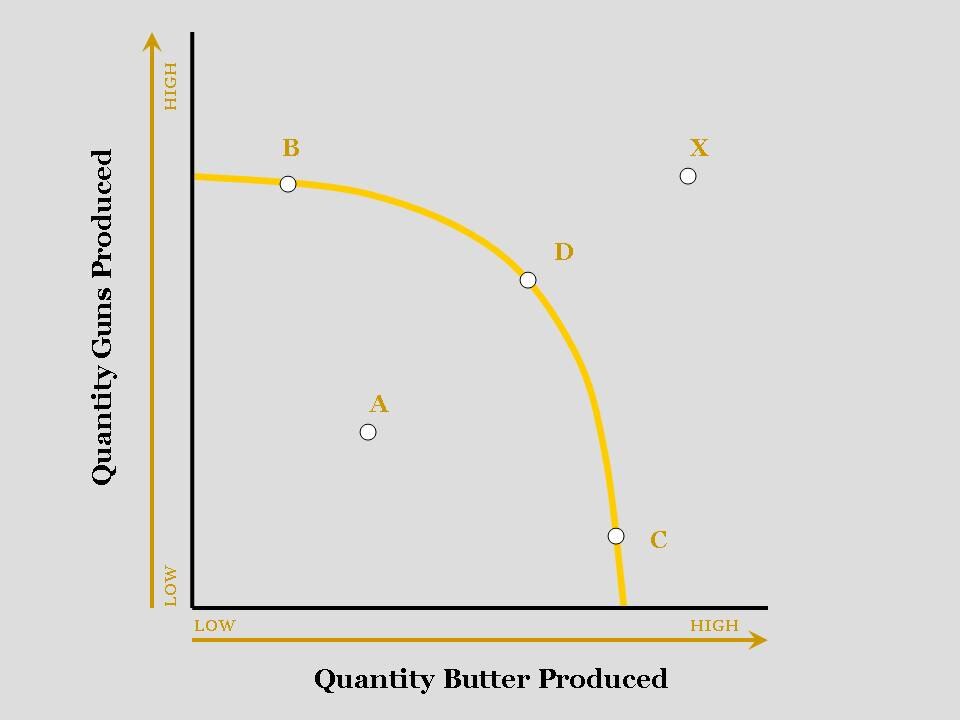
The Production Possibilities Frontier (PPF) diagram shows the maximum possible output combinations of two goods that an economy can achieve using all resources fully and efficiently. Points on the curve represent productive efficiency, while points inside the curve indicate inefficiency. Source
This means:
No underemployment or idle resources.
All factors of production (land, labour, capital, enterprise) are engaged.
Output is at the maximum possible for given inputs and technology.
However, productive efficiency does not guarantee that the output mix is what society most desires.
Allocative Efficiency
Allocative Efficiency: When resources are distributed to produce the combination of goods and services most valued by society, where marginal benefit equals marginal cost.
On the PPF, only certain points reflect allocative efficiency.
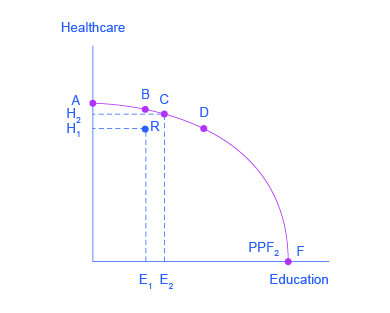
The diagram illustrates the difference between productive and allocative efficiency. Points on the PPF curve (like B, C, and D) are productively efficient, while the allocatively efficient point depends on societal preferences, which may not always coincide with productive efficiency. Source
A point may be productively efficient but allocatively inefficient if the output combination does not match consumer preferences. For example:
If an economy produces too many capital goods and too few consumer goods, living standards may fall despite productive efficiency.
Allocative efficiency depends on the societal balance between goods, not just maximum output.
Comparing Productive and Allocative Efficiency
Key differences:
Productive efficiency is a technical condition — using resources without waste.
Allocative efficiency is a value-based condition — producing what society most values.
All allocatively efficient points are productively efficient, but not all productively efficient points are allocatively efficient.
Applied Use of the PPF
The PPF can illustrate efficiency concepts in several applied contexts.
1. Changes in Consumer Preferences
If consumer preferences change, the allocatively efficient point on the PPF will shift. For example:
Increased demand for renewable energy could move the allocatively efficient point towards more capital goods for wind turbines and fewer fossil-fuel-based consumer goods.
2. Technological Change
Advances in technology can shift the PPF outward. While all points on the new frontier remain productively efficient, allocative efficiency depends on whether the new mix meets societal needs.
3. Policy Decisions
Governments may prioritise certain goods over others. For instance:
A wartime economy may choose more military goods and fewer consumer goods.
This choice may be productively efficient but allocatively inefficient from the perspective of peacetime welfare.
4. Trade-offs
The PPF shows trade-offs — producing more of one good means producing less of another. This underpins opportunity cost.
Opportunity Cost: The value of the next best alternative foregone when a choice is made.
While opportunity cost applies to all points on the PPF, the optimal trade-off point (allocative efficiency) depends on societal values.
Evaluating Efficiency Using the PPF
To determine efficiency:
Step 1: Check if the point is on the PPF — confirms productive efficiency.
Step 2: Assess whether the mix of goods matches societal preferences — confirms allocative efficiency.
Inefficiency and the PPF
Points inside the PPF are both productively and allocatively inefficient due to underutilised resources. Points outside the PPF are unattainable without more resources or improved technology.
Key Takeaways for Applied Analysis
When applying this to real-world economics:
Use the PPF to separate technical efficiency from value-based efficiency.
Recognise that economic policy often involves moving along the PPF, changing the balance between goods while remaining productively efficient.
Understand that only when marginal benefit = marginal cost does the economy achieve allocative efficiency.
Summary List: Efficiency on the PPF
All points on the PPF: Productively efficient.
Only specific points on the PPF: Allocatively efficient.
Inside the PPF: Inefficient use of resources.
Outside the PPF: Unattainable without growth.
Policy shifts and preference changes move the allocatively efficient point along the frontier.
Practice Questions
Define allocative efficiency and explain how it differs from productive efficiency in the context of a production possibility frontier (PPF). (2 marks)
1 mark for a correct definition of allocative efficiency (e.g., when resources are distributed to produce the combination of goods and services most valued by society, where marginal benefit equals marginal cost).
1 mark for explaining the difference from productive efficiency (e.g., productive efficiency means producing maximum output with given resources, whereas allocative efficiency focuses on producing the right mix of goods according to societal preferences).
Using a production possibility frontier (PPF) diagram, explain why all points on the PPF are productively efficient but not all are allocatively efficient. (5 marks)
1 mark for stating that all points on the PPF represent full utilisation of resources.
1 mark for explaining that productive efficiency occurs when it is impossible to produce more of one good without producing less of another.
1 mark for defining allocative efficiency as producing the combination of goods most valued by society.
1 mark for explaining that only certain points on the PPF meet this condition because societal preferences determine the optimal mix.
1 mark for correctly referring to the diagram to illustrate that while all points on the boundary are productively efficient, only the allocatively efficient point matches marginal benefit with marginal cost.
FAQ
A change in relative prices alters the marginal benefit and marginal cost of goods. This shifts consumer demand and, in turn, changes the allocatively efficient point.
For example, if the price of renewable energy falls relative to fossil fuels, the optimal mix on the PPF may move towards more renewable energy production and less fossil fuel output. This adjustment reflects society’s new preferences based on relative costs and benefits.
Allocatively efficient points depend on societal preferences, which can vary between economies.
One society might value consumer goods more, choosing a point with higher consumer goods output.
Another might prioritise capital goods for future growth, opting for a different point.
Even with identical productive capacity, the “right” mix differs according to cultural, political, and economic priorities.
Government policy can influence the allocation of resources through:
Taxes and subsidies to change relative prices.
Regulations or quotas to promote or restrict production of specific goods.
Public spending to provide goods directly (e.g., healthcare, infrastructure).
These tools can shift production along the PPF towards a point that better matches societal needs.
Yes. Allocative efficiency can change even if the PPF remains fixed.
This happens when consumer preferences, resource priorities, or policy objectives change. For instance, increased concern about climate change may alter the optimal mix of goods, moving the allocatively efficient point without altering the economy’s overall productive capacity.
Allocative efficiency focuses on meeting current societal preferences, but this may conflict with:
Long-term economic growth if more resources are devoted to consumer goods rather than capital goods.
Equity goals if the allocation benefits certain groups disproportionately.
Environmental sustainability if current preferences involve resource depletion.
Balancing these objectives requires policy choices beyond simply aiming for allocative efficiency.
