
AQA Specification focus:
‘A demand curve shows the relationship between price and quantity demanded; the causes of shifts in the demand curve.’
The demand curve illustrates how consumers respond to price changes and how external factors shift overall demand. Understanding shifts is central to analysing real-world markets effectively.
The Demand Curve
The demand curve shows the relationship between the price of a good or service and the quantity demanded by consumers over a period of time. Typically, the curve slopes downwards from left to right, indicating that as the price falls, quantity demanded increases, reflecting the law of demand.
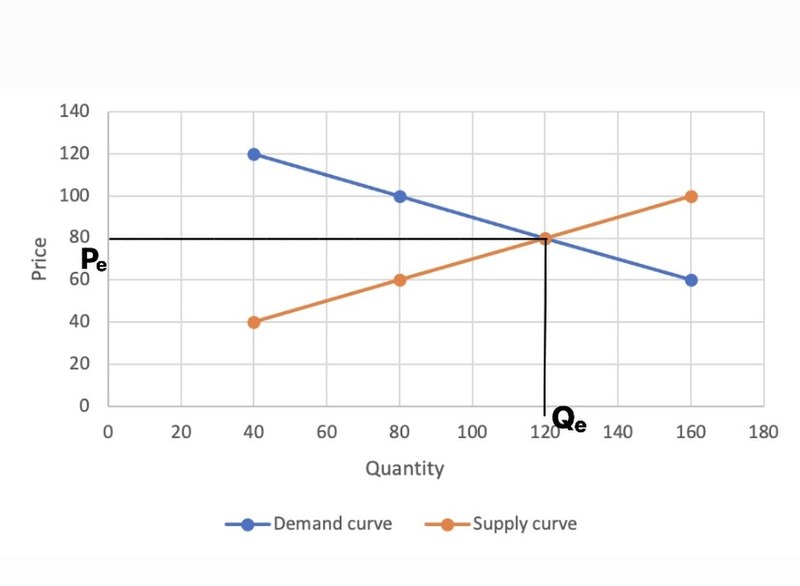
This diagram illustrates the law of demand, depicting a downward-sloping demand curve where an increase in price leads to a decrease in quantity demanded, and vice versa. Source
Law of Demand: When the price of a good decreases, the quantity demanded increases, ceteris paribus (all other factors held constant).
This negative relationship exists because lower prices make a good more affordable, attracting both new consumers and encouraging existing consumers to purchase more.
Movements along the Demand Curve
A change in the price of a good results in a movement along the demand curve.
A fall in price leads to an extension of demand (higher quantity demanded).
A rise in price leads to a contraction of demand (lower quantity demanded).
These movements occur only because of price changes, with all other determinants of demand held constant.
Shifts in the Demand Curve
Unlike movements, shifts in the demand curve occur when non-price factors change, altering demand at every possible price. This means the entire demand curve moves either to the right (increase in demand) or to the left (decrease in demand).
Causes of Demand Curve Shifts
Several key determinants cause shifts in demand:
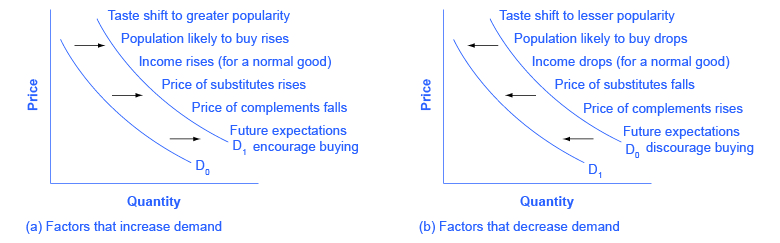
This diagram categorises the main factors influencing shifts in the demand curve, including changes in income, prices of related goods, consumer preferences, and expectations. Source
Changes in consumer incomes
Rising incomes generally increase demand for normal goods (goods for which demand rises as income increases).
For inferior goods (goods for which demand falls as income rises), higher incomes shift demand leftward.
Changes in tastes and preferences
Shifts in consumer preferences, such as healthier lifestyles or new fashions, can increase demand for certain goods while reducing it for others.
Changes in the prices of related goods
Substitutes: An increase in the price of one substitute (e.g., tea) raises demand for its alternative (e.g., coffee).
Complements: A fall in the price of a complement (e.g., printers) increases demand for the related good (e.g., ink cartridges).
Expectations of future prices
If consumers expect prices to rise in the future, demand may increase in the present as they stock up.
Population and demographics
A growing population shifts demand to the right across many markets.
Demographic changes (e.g., ageing population) alter demand for specific goods such as healthcare services.
Government policies and regulation
Taxes, subsidies, and regulation affect affordability and attractiveness of goods. For example, subsidies for renewable energy increase demand for solar panels.
Advertising and information
Successful advertising campaigns or better consumer awareness of benefits can boost demand significantly.
Representing Shifts Graphically
When demand increases due to non-price factors, the demand curve shifts outward to the right, meaning more is demanded at every price. Conversely, if demand decreases, the curve shifts inward to the left, reducing quantity demanded at all price levels.
Incentives Behind Demand Curve Shifts
Shifts in demand reflect the broader incentives influencing consumer behaviour. For instance, rising incomes incentivise greater spending power, while falling prices of complements encourage associated purchases. These shifts provide critical insight for firms in making production and pricing decisions.
Linking Demand Shifts to Market Analysis
Demand shifts are vital for analysing real-world markets because they help explain why equilibrium prices and quantities change even when the price of the good itself has not altered. For example:
A rise in consumer incomes shifts the demand curve for luxury goods rightward, raising equilibrium prices and quantities.
A public health campaign against smoking shifts demand leftward for cigarettes, reducing both equilibrium price and quantity.
The Role of Ceteris Paribus
The concept of ceteris paribus is essential when discussing demand. It assumes all other factors remain unchanged when examining the relationship between price and demand. In reality, multiple factors can change simultaneously, but this simplifying assumption allows economists to isolate cause-and-effect relationships clearly.
Ceteris Paribus: A Latin phrase meaning “all other things being equal,” used to isolate the impact of one variable on another in economic analysis.
Without this assumption, it would be impossible to distinguish between a movement along a demand curve and a genuine shift in demand.
Importance for Firms and Policymakers
For businesses, predicting demand shifts helps in pricing strategies, production planning, and investment decisions. A firm must understand whether a change in sales results from a price adjustment (movement along the curve) or an external shift (change in demand conditions).
For policymakers, demand shifts are central to analysing the impact of taxation, subsidies, and regulation. For instance, introducing a sugar tax aims to shift the demand curve for sugary drinks leftward, reducing consumption.
Practice Questions
Explain the difference between a movement along a demand curve and a shift in the demand curve. (2 marks)
1 mark for identifying that a movement along the demand curve is caused only by a change in the price of the good or service.
1 mark for identifying that a shift in the demand curve is caused by non-price factors such as income, tastes, or the price of related goods.
Discuss two factors that might cause the demand curve for electric cars to shift to the right. (6 marks)
Up to 2 marks for correctly identifying two separate factors (e.g., rising consumer incomes, government subsidies, falling prices of complementary goods such as charging stations, changes in tastes towards environmental awareness).
Up to 2 marks for explaining why each factor increases demand at all price levels (e.g., higher incomes increase affordability, subsidies reduce effective prices, complementary goods make usage easier, social preferences increase desirability).
Up to 2 marks for application to the context of electric cars (e.g., linking subsidies to green policy goals, linking tastes to climate change awareness, linking income rises to luxury purchases).
Maximum: 6 marks.
FAQ
A downward sloping demand curve shows the inverse relationship between price and quantity demanded. This reflects consumer behaviour: as price decreases, more people can afford the good, while existing consumers may buy more.
The slope highlights the principle of diminishing marginal utility — each additional unit consumed provides less satisfaction, so consumers will only buy extra units if the price falls.
Yes, in rare cases. An upward-sloping demand curve is known as a Giffen good or a Veblen good.
Giffen goods: Inferior goods where higher prices lead to greater demand because the income effect outweighs the substitution effect.
Veblen goods: Luxury items where higher prices make the good more desirable due to its status appeal.
Advertising increases consumer awareness and can create or reinforce preferences for a product, causing an outward shift of the demand curve.
This means at every price level, more of the good is demanded because:
Consumers are persuaded of the product’s benefits.
Brand loyalty reduces sensitivity to price.
Positive messaging may increase the perceived value of the good.
Ceteris paribus ensures only one factor — price — is considered when examining movements along the demand curve. Without this assumption, it would be unclear whether changes in demand result from price or external influences.
In practice, real markets experience simultaneous changes in income, tastes, or related goods. Ceteris paribus isolates the price effect, making economic models more useful for analysis.
If consumers expect prices to rise in the future, they may increase present demand, shifting the demand curve outward. Conversely, expected future price falls may delay purchases, shifting demand inward.
For example, if petrol prices are expected to rise, consumers may fill their tanks now. This behaviour is short-term but powerful, affecting current equilibrium in the market.
