
AQA Specification focus:
‘The concept of the minimum efficient scale of production; categorise and give examples of both internal and external economies of scale; understand the significance of the minimum efficient scale for the structure of an industry and barriers to entry.’
The minimum efficient scale (MES) defines the lowest point on the long-run average cost curve where firms achieve productive efficiency, influencing industry structure, competition, and entry barriers.
Minimum Efficient Scale (MES)
The Minimum Efficient Scale (MES) is the lowest level of output at which a firm can produce at the lowest long-run average cost (LRAC). At this point, a firm is said to have fully exploited all available economies of scale. Beyond MES, costs remain constant or only change insignificantly with increased production.
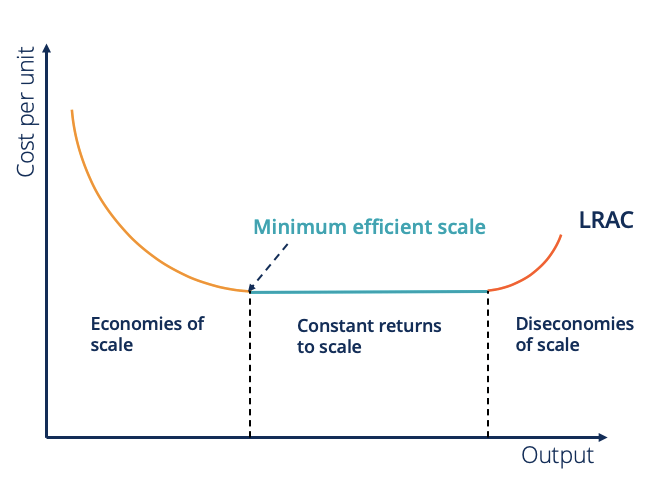
This graph depicts the LRAC curve, marking the MES where average costs are minimized. It demonstrates how firms can achieve productive efficiency by operating at this scale, beyond which they experience constant returns to scale. Source
Minimum Efficient Scale (MES): The smallest quantity of output at which long-run average cost is minimised, ensuring productive efficiency.
MES is vital because it determines how large firms need to be to compete efficiently within an industry. If MES is small relative to market demand, many firms can coexist; if MES is large relative to demand, the market may support only a few dominant firms.
Economies of Scale and MES
Economies of scale occur when increasing the scale of production reduces average costs. These reductions feed directly into the size of the MES.
Internal Economies of Scale
Internal economies occur within a single firm and are achieved as it grows. These include:
Technical economies: Efficiency gains from larger, more specialised machinery.
Managerial economies: Specialist managers lower administrative costs per unit.
Financial economies: Larger firms secure cheaper borrowing rates.
Marketing economies: Bulk advertising spreads costs over higher output.
Purchasing economies: Bulk buying lowers input costs.
External Economies of Scale
External economies occur when the industry as a whole grows, lowering costs for all firms. These include:
Shared suppliers reducing input costs.
Skilled labour pools concentrated in industry hubs.
Infrastructure development tailored to the needs of the industry.
Economies of Scale: Cost advantages that a firm experiences as it increases output, leading to lower average costs.
The point where economies of scale are fully exploited is the MES.
Diseconomies of Scale and MES
After a certain size, firms may suffer from diseconomies of scale, which increase average costs.
These may stem from:
Communication problems in very large organisations.
Coordination difficulties between divisions.
Bureaucratic inefficiency due to complex layers of management.
MES is therefore reached just before diseconomies of scale begin to dominate.
MES and Industry Structure
MES has a powerful influence on how industries are structured:
Small MES relative to market demand
Many firms can operate efficiently.
Industry structure tends to be competitive (e.g., restaurants, local services).
Large MES relative to market demand
Only a few firms can reach efficient scale.
Industry structure may be oligopolistic or monopolistic (e.g., airlines, utilities).
Very high MES close to total market demand
Industry may be a natural monopoly, where one large firm is most efficient (e.g., water supply).
MES and Barriers to Entry
MES creates barriers to entry when the scale required to achieve efficiency is very high. New entrants may face the challenge of producing at a small, inefficient scale, which leads to higher costs and uncompetitive pricing. This discourages entry into industries with:
Large initial capital requirements.
High MES relative to market demand.
Strong economies of scale that established firms already exploit.
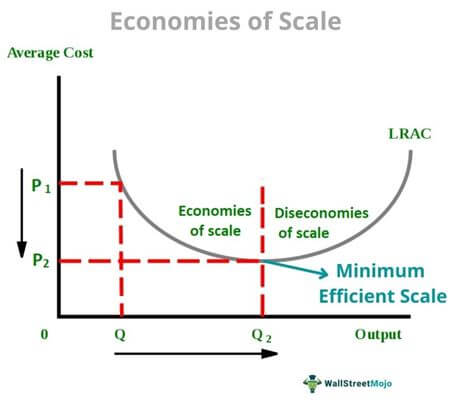
This diagram highlights the relationship between MES and market structure. It shows how a high MES can limit the number of firms that can operate efficiently, leading to monopolistic or oligopolistic market structures. Source
Barrier to Entry: Any obstacle that prevents new firms from entering a market and competing effectively.
Industries with a high MES (e.g., petrochemicals, railways) have fewer firms and higher entry barriers, whereas industries with a low MES (e.g., retail shops) are more competitive and open to entrants.
Examples of MES in Industry Context
Automobile manufacturing: Requires very high capital investment, with MES reached at high output levels. This creates oligopolistic structures dominated by large multinational firms.
Pharmaceuticals: Significant research and development costs mean firms must reach a high MES before operating profitably, creating strong barriers to entry.
Restaurants: MES is very low, allowing thousands of firms to compete in local markets.
These examples demonstrate how the size of MES relative to market demand shapes competition and determines whether industries are fragmented, oligopolistic, or monopolistic.
Relationship Between Returns to Scale and MES
MES is linked to the concept of returns to scale:
Increasing returns to scale: Output increases by a greater proportion than inputs, driving down LRAC.
Constant returns to scale: Output and inputs rise proportionally, LRAC remains flat — MES is reached here.
Decreasing returns to scale: Output rises by less than inputs, causing LRAC to increase.
The MES lies at the transition from increasing to constant returns to scale.
Long-Run Average Cost (LRAC) = Total Costs ÷ Quantity of Output
Total Costs = Fixed Costs + Variable Costs
LRAC = Cost per unit at a given scale of production
This equation underlines why achieving MES is central to long-run efficiency: once LRAC stops falling, further expansion provides little or no cost advantage.
Practice Questions
Define the minimum efficient scale (MES) of production. (2 marks)
1 mark for stating it is the lowest level of output where long-run average costs are minimised.
1 mark for mentioning that at this scale all economies of scale have been fully exploited.
Explain how the size of the minimum efficient scale (MES) relative to market demand can influence the structure of an industry. (6 marks)
Up to 2 marks for explaining that if MES is small relative to market demand, many firms can operate efficiently, leading to competitive structures.
Up to 2 marks for explaining that if MES is large relative to demand, only a few firms can achieve efficiency, resulting in oligopolistic or monopolistic structures.
1 mark for linking a very high MES to the possibility of a natural monopoly.
1 mark for clear application, such as using examples (e.g., airlines, utilities, restaurants).
FAQ
The MES depends on the nature of production technology and cost structures within an industry. Industries with heavy fixed costs, such as steel or energy, require very high output before average costs stabilise. In contrast, service-based industries with low capital requirements, like cafes, can reach MES at small output levels.
Government intervention can alter MES through subsidies, regulation, or infrastructure investment. For example:
Subsidies for machinery can reduce fixed costs, lowering MES.
Stricter regulations may raise compliance costs, pushing MES higher.
Public investment in transport or energy infrastructure can reduce operating costs, lowering MES.
Differences in technology, labour costs, and market size all influence MES. A large domestic market like the United States allows firms to scale production more easily, lowering average costs at higher output. Smaller economies may have fewer opportunities for large-scale production, meaning MES is reached at a lower absolute output level.
Yes. Technological innovations often reduce MES by lowering production costs or making processes more flexible. For instance:
Automation can cut labour costs, lowering the output needed for efficiency.
Advances in modular production reduce the scale of investment required, making MES achievable at smaller sizes.
When MES is high, new firms must invest heavily to compete at the same efficiency as established firms. If they enter at a smaller scale, they face higher costs and uncompetitive prices. This discourages entry and strengthens the position of incumbent firms.
Barriers are strongest in industries with:
Large capital requirements (e.g., oil refining).
High fixed costs spread only at large output levels.
Established firms already operating at MES.
