
AQA Specification focus:
‘The difference between internal and external economies of scale; reasons for diseconomies of scale; the relationship between returns to scale and economies or diseconomies of scale; the relationship between economies of scale, diseconomies of scale and the shape of the long-run average cost curve; the L-shaped long-run average cost curve.’
Understanding economies and diseconomies of scale is vital in economics, as they explain how firm size influences long-run costs, industry structure, and competitive efficiency.
Economies of Scale
Economies of scale occur when an increase in the scale of production leads to a fall in long-run average cost (LRAC). They arise because larger firms can spread costs, gain efficiencies, and utilise resources more effectively.
Internal Economies of Scale
These are cost advantages that occur within a single firm as it expands production.
Internal Economies of Scale: Cost reductions experienced by a firm as it increases output, achieved through efficiencies internal to the firm.
Types of internal economies of scale include:
Technical economies: Large firms can use more advanced, efficient machinery with higher productivity.
Managerial economies: Larger firms can employ specialist managers, improving decision-making and efficiency.
Purchasing economies: Bulk buying allows firms to negotiate discounts on raw materials.
Financial economies: Larger firms often borrow at lower interest rates due to lower risk.
Risk-bearing economies: Diversification across markets reduces business risk.
Marketing economies: Spreading advertising costs across a larger output reduces per-unit costs.
External Economies of Scale
These are cost advantages that occur outside an individual firm but benefit all firms in an industry as the industry grows.
External Economies of Scale: Reductions in average cost that arise when the expansion of an entire industry creates advantages for all firms within it.
Examples include:
Skilled labour pools: A concentrated industry attracts a trained workforce.
Shared infrastructure: Transport, communications, and supplier networks improve as industry clusters develop.
Knowledge spillovers: Innovation spreads across firms located in close proximity, encouraging efficiency.
This diagram contrasts internal and external economies of scale. Internal economies arise from within a firm, such as technical improvements and managerial efficiencies. External economies result from factors outside a firm, like industry clustering and shared infrastructure. Source
Diseconomies of Scale
While economies of scale reduce costs, firms may eventually experience diseconomies of scale, where average costs rise as output increases. These occur because large organisations become more difficult to manage and coordinate.
Diseconomies of Scale: Increases in long-run average costs as a firm expands output, typically caused by inefficiencies associated with large-scale operations.
Key reasons include:
Managerial diseconomies: Communication breakdowns and slower decision-making in very large firms.
Motivational diseconomies: Workers in large organisations may feel less valued, reducing productivity.
Bureaucratic diseconomies: Excessive layers of management lead to inefficiency and rigidity.
Resource constraints: Rising demand for specialised inputs may push prices up, raising costs.
Relationship with Returns to Scale
Returns to scale describe how output changes as all factor inputs increase in the long run.
Returns to Scale: The proportionate change in output when all factor inputs are increased by the same proportion in the long run.
Increasing returns to scale: Output increases by a greater proportion than inputs, leading to economies of scale.
Constant returns to scale: Output increases in the same proportion as inputs, keeping LRAC constant.
Decreasing returns to scale: Output increases by a smaller proportion than inputs, resulting in diseconomies of scale.
Thus, the concept of returns to scale directly underpins the explanation of why average costs fall, flatten, or rise in the long run.
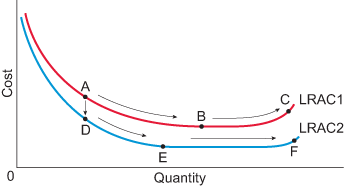
The U-shaped Long-Run Average Cost (LRAC) curve illustrates how average costs decline with increased output due to economies of scale and subsequently rise due to diseconomies of scale. The minimum point represents the most efficient scale of production. Source
Economies, Diseconomies, and LRAC Shape
The long-run average cost (LRAC) curve reflects the interaction between economies and diseconomies of scale.
At low levels of output, internal and external economies of scale dominate, pulling LRAC downwards.
At higher output, diseconomies of scale outweigh benefits, pushing LRAC upwards.
This gives the LRAC curve its U-shape.
However, empirical evidence suggests that many industries experience an L-shaped LRAC curve. This means that after initial economies of scale are exhausted, costs stabilise rather than rising sharply, because firms adopt modern technologies, management practices, or flexible production systems.
L-shaped LRAC Curve: A long-run average cost curve where costs fall with economies of scale and then remain flat, reflecting sustained efficiency at large scale.
Key Connections
Internal economies benefit individual firms, while external economies benefit whole industries.
Diseconomies of scale explain why firms cannot expand indefinitely without cost consequences.
Returns to scale provide the theoretical framework linking inputs to outputs, explaining movements along the LRAC.
The shape of the LRAC curve captures how costs evolve in the long run, influencing industry structure, firm size, and competitiveness.
Practice Questions
Define internal economies of scale and give one example. (2 marks)
Definition of internal economies of scale: cost reductions experienced by a firm as it increases output, achieved through efficiencies internal to the firm (1 mark).
Example such as technical economies, managerial economies, purchasing economies, financial economies, marketing economies, or risk-bearing economies (1 mark).
Explain how the presence of both economies and diseconomies of scale affects the shape of the long-run average cost (LRAC) curve. (6 marks)
Identification that economies of scale cause LRAC to fall as output rises (1 mark).
Explanation that diseconomies of scale cause LRAC to rise after a certain point (1 mark).
Clear description that the interaction of economies and diseconomies creates a U-shaped LRAC curve (1 mark).
Recognition of the concept of the minimum efficient scale or the lowest point on the LRAC (1 mark).
Additional development: mention of the possibility of an L-shaped LRAC due to sustained efficiencies or technological improvements (1 mark).
Use of appropriate economic terminology and logical, structured explanation (1 mark).
FAQ
Industries that rely on clustering, specialist suppliers, or shared infrastructure tend to benefit the most from external economies of scale.
Examples include:
High-tech industries in regions like Silicon Valley, where innovation spillovers occur.
Financial services in London, which benefit from a skilled labour pool and shared support services.
Manufacturing hubs where transport links and specialised suppliers are concentrated.
Firms may deliberately limit growth to prevent diseconomies of scale. Large size often leads to complex hierarchies, slower decision-making, and weaker employee motivation.
Additionally, smaller firms may choose to remain niche producers, focusing on flexibility and personalised services rather than pursuing large-scale cost advantages.
Economies of scale describe the cost savings achieved as output expands.
Minimum efficient scale refers to the lowest level of output at which all significant internal economies of scale have been realised. Beyond this point, further expansion may not reduce costs, and diseconomies could emerge.
Technological progress can prevent average costs from rising at high output levels.
Advances in automation, logistics, and management software reduce coordination problems and improve productivity. As a result, firms can operate at large scales without experiencing traditional diseconomies, creating a flatter LRAC curve.
Yes, external diseconomies occur when industry expansion raises costs for all firms.
Examples include:
Overcrowding in industrial regions increasing congestion and transport delays.
Rising competition for limited resources pushing up input prices.
Environmental degradation or stricter regulations raising compliance costs.
Such factors shift the LRAC upwards for the entire industry, even if individual firms remain efficient internally.
