
AQA Specification focus:
‘The demand for a factor is derived from the demand for the product; the marginal productivity theory of the demand for labour; the demand curve for labour shows the relationship between the wage rate and number of workers employed; the causes of shifts in the demand curve for labour.’
Labour demand in economics stems from firms’ need to employ workers to produce goods and services. Understanding derived demand, marginal productivity, and the labour demand curve is essential.
Derived Demand for Labour
The demand for labour is derived demand, meaning it depends on the demand for the final product that labour helps to produce. Firms do not hire workers for their own sake; instead, they employ them because workers contribute to producing goods and services that can be sold.
Derived Demand: Demand for a factor of production that arises from the demand for the goods and services that the factor helps to produce.
For example, if demand for electric cars increases, firms in that industry will demand more labour (e.g., engineers, assembly workers). Conversely, if demand falls, labour demand contracts.
Key influences on derived demand include:
Consumer demand for the final good or service.
Price elasticity of demand for the final product — if demand is elastic, changes in output will strongly affect labour demand.
Complementary inputs — e.g., technology and capital working alongside labour.
Marginal Productivity Theory of Labour Demand
The marginal productivity theory states that a firm will hire workers up to the point where the value of their marginal revenue product (MRP) equals the wage rate.
Marginal Revenue Product (MRP): The additional revenue a firm earns from employing one extra unit of labour, calculated as marginal product of labour (MPL) × marginal revenue (MR).
Marginal Revenue Product (MRP) = Marginal Product of Labour (MPL) × Marginal Revenue (MR)
MPL = The additional output produced by one more worker (units of output).
MR = The additional revenue from selling one extra unit of output (£ per unit).
This implies that:
If the MRP of a worker exceeds the wage, hiring more workers increases profit.
If the MRP is lower than the wage, the firm reduces employment.
Profit maximisation occurs where MRP = Wage rate.
Factors affecting MRP include:
Productivity of labour (skills, training, experience).
Price of the product (higher prices increase MR and MRP).
Technology (capital can increase or reduce labour productivity).
Under perfect competition, a firm’s demand for labour equals the value of the marginal product of labour (VMPL).
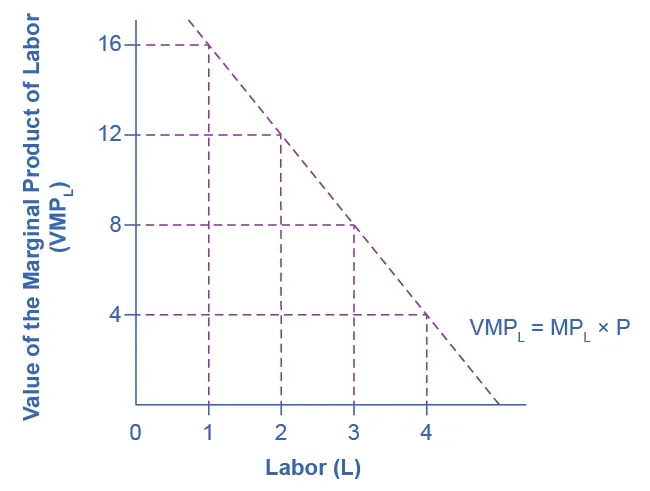
This figure shows the VMPL schedule, derived as MPL × P. Because MPL diminishes as more workers are hired, the VMPL curve slopes downward. In a competitive output market, this VMPL curve is the firm’s demand for labour. Source
The Labour Demand Curve
The labour demand curve shows the relationship between the wage rate and the number of workers firms are willing to employ.
Labour Demand Curve: A graphical representation showing how many workers firms are willing to hire at different wage rates, holding other factors constant.
Key features:
It is downward sloping — as wages fall, employing more workers becomes profitable since MRP is more likely to exceed the wage.
At higher wages, fewer workers are demanded because only those with very high MRPs justify their cost.
The labour demand curve shows the relationship between the wage rate and number of workers employed.
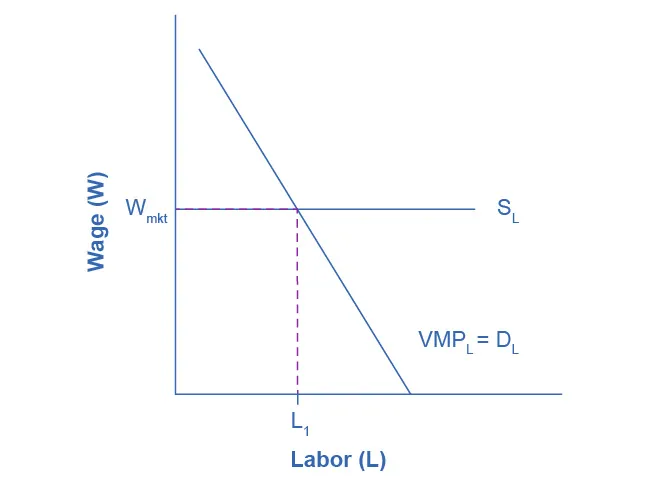
At the going market wage, a competitive firm hires up to L₁ where the wage equals VMPL. The downward-sloping VMP_L = D_L curve captures how a higher wage reduces the quantity of labour demanded. This is the textbook depiction of wage–employment determination for a price-taking firm. Source
Shifts in the Labour Demand Curve
While movement along the demand curve occurs due to changes in the wage rate, the entire demand curve can shift due to other factors.
Causes of shifts include:
Change in demand for the product: If demand for the final good rises, MRP increases, shifting the demand curve right.
Change in productivity: Higher productivity (through skills, education, or innovation) raises MRP, increasing labour demand.
Change in the price of substitutes or complements: If capital (e.g., machinery) becomes cheaper, labour demand may fall; if capital complements labour, demand may rise.
Technological change: Labour-saving technology can reduce demand, while labour-augmenting technology can boost demand.
Changes in output prices: If product prices rise, MR rises, increasing MRP and shifting demand rightward.
An increase in product demand or labour productivity shifts the demand for labour to the right; a fall shifts it to the left.
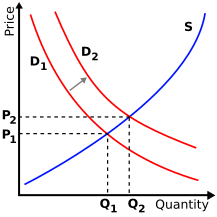
This diagram illustrates an outward shift of demand from D₀ to D₁ at every price. Interpreted for the labour market, stronger product demand or higher productivity shifts D_L rightward, raising employment at a given wage. Extra detail: the axes read Price and Quantity here; for labour, read them as Wage and Employment. Source
Interaction of Derived Demand, MRP, and the Labour Demand Curve
The concepts are interlinked:
Labour demand originates from product demand (derived demand).
Firms apply the marginal productivity theory to decide the optimal number of workers.
The labour demand curve reflects these decisions across wage levels.
Thus, any factor that changes output demand, labour productivity, or product price will affect labour demand through the MRP mechanism and shift the curve.
Practice Questions
Explain what is meant by the term derived demand in the context of the labour market. (3 marks)
1 mark for stating that derived demand is when the demand for labour depends on the demand for the good/service it produces.
1 mark for recognising that labour is not demanded for its own sake but for the value it creates in production.
1 mark for giving an example (e.g. higher demand for cars increases demand for car workers).
Using the marginal productivity theory, explain how a firm decides the number of workers to employ. (6 marks)
1 mark for correctly identifying that firms employ workers based on marginal revenue product (MRP).
1 mark for stating that MRP is calculated as marginal product of labour (MPL) × marginal revenue (MR).
1 mark for explaining that firms employ additional workers as long as MRP exceeds or equals the wage rate.
1 mark for noting that when MRP falls below the wage, employing more workers is not profitable.
1 mark for recognising that the demand curve for labour is derived from the MRP curve.
1 mark for clear, logical explanation with reference to profit maximisation.
FAQ
When consumer preferences shift, the demand for certain products rises or falls. This directly affects labour demand in the related industry.
For example, a growing preference for renewable energy increases labour demand for solar panel engineers, while reduced demand for coal decreases labour demand in mining.
The MRP curve slopes downwards due to diminishing marginal returns. Each additional worker adds less extra output once capital and other resources are fixed.
As a result:
MPL decreases after a certain point.
With constant output prices, MRP also falls.
This explains why firms are less willing to pay high wages for larger numbers of workers.
Labour demand can shift rapidly due to:
Technological breakthroughs, e.g. automation reducing routine job demand.
Regulatory changes, e.g. stricter emissions laws increasing demand for environmental specialists.
Shocks to consumer demand, such as global pandemics changing service industry labour needs.
In theory, firms hire based on MRP, but in reality measurement is difficult. Productivity is influenced by teamwork, capital, and variable efficiency.
Firms often use estimates from:
Output per worker data.
Revenue-per-department calculations.
Historical performance records.
This makes MRP a useful model but less precise in practical application.
If capital and labour are complements, investment in machinery can raise productivity and increase MRP, boosting labour demand.
However, if capital substitutes for labour, such as in automated manufacturing, demand for workers falls. The effect depends on whether capital enhances or replaces human effort in the production process.
