
AQA Specification focus:
‘The supply of labour to a particular occupation is influenced by monetary and non-monetary considerations; non-monetary considerations include job satisfaction and dissatisfaction and working conditions; the supply curve for labour shows the relationship between the wage rate and number of workers willing to work in an occupation; the causes of shifts in the market supply curve for labour; students will not be required to understand the determinants of an individual’s supply of labour or the backward-bending supply curve.’
Labour supply in a given occupation is shaped by both monetary rewards and non-monetary factors, with shifts in the supply curve reflecting broader changes in employment conditions.
The Nature of Labour Supply at the Market Level
The supply of labour refers to the total number of workers willing and able to work in a particular occupation at different wage rates. At the market level, this represents the aggregation of all individual labour supply decisions, forming a market labour supply curve. This curve shows the positive relationship between the wage rate and the quantity of labour supplied: as wages increase, more workers are typically willing to enter the occupation.
Labour Supply Curve: A graphical representation showing the relationship between the wage rate and the number of workers willing to work in an occupation.
The supply curve for labour shows the relationship between the wage rate and number of workers willing to work in an occupation.
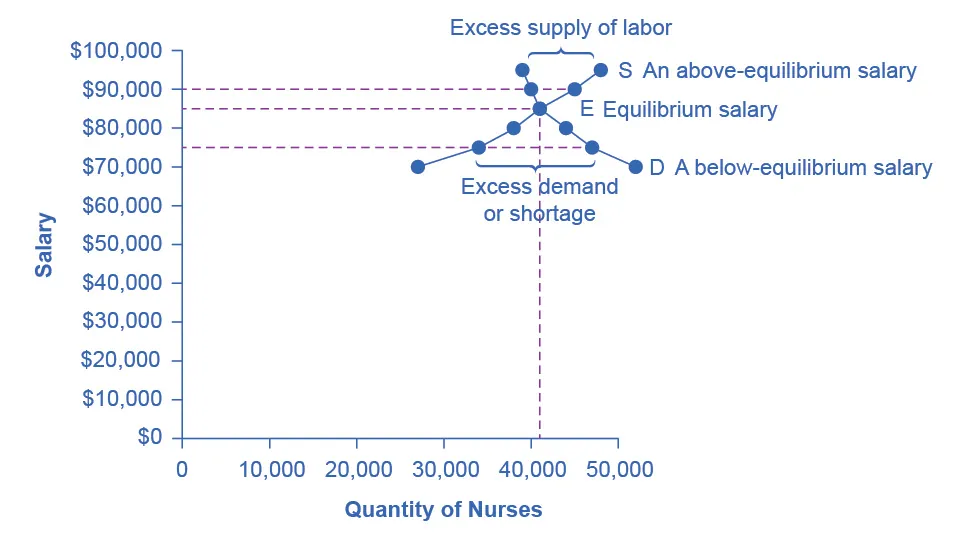
A market for labour with wage (salary) on the vertical axis and quantity of labour on the horizontal axis. The supply curve (S) is upward-sloping; together with demand (D) it determines the market equilibrium wage and employment. Surplus and shortage at non-equilibrium wages are shown. Source
Monetary Factors Affecting Labour Supply
Workers’ decisions to supply labour are strongly influenced by monetary considerations. Higher wages generally attract more workers to an occupation and encourage existing workers to increase their hours. Key monetary factors include:
Wage Levels: Higher pay draws more workers into the labour market.
Overtime and Bonuses: Additional payments make occupations more attractive.
Pensions and Benefits: Generous financial packages can retain workers in a job.
These elements create incentives for individuals to either enter an occupation or remain employed within it.
Non-Monetary Considerations in Labour Supply
Beyond pay, non-monetary factors have a significant impact on labour supply decisions. These often determine whether workers find a job attractive or sustainable in the long term. Important examples include:
Job Satisfaction: Workers may accept lower wages if they find the work personally rewarding.
Working Conditions: Safe, healthy, and flexible conditions improve labour supply.
Work–Life Balance: Opportunities for flexible hours or remote work can encourage participation.
Geographic Location: Proximity to home or affordable commuting options makes certain jobs more appealing.
Non-Monetary Considerations: Job-related benefits or drawbacks other than pay that affect the willingness of workers to supply labour, such as satisfaction or working conditions.
Non-monetary factors are particularly influential in occupations with high stress levels or poor working environments, where even high pay may not compensate for dissatisfaction.
Non-monetary considerations include job satisfaction and dissatisfaction and working conditions.

A hedonic-wage diagram showing job amenities/risks on one axis and wage on the other, with indifference curves and a hedonic wage function. It illustrates compensating wage differentials—jobs with poorer conditions must pay more to attract the same workers. Note: this extends beyond the AQA requirement but supports the idea that working conditions affect labour supply. Source
Shifts in the Labour Supply Curve
While the labour supply curve normally slopes upwards, it can shift to the left (decrease in supply) or to the right (increase in supply) depending on various factors. Shifts are not due to changes in the wage rate itself but are instead driven by external influences on workers’ willingness or ability to take employment.
A change in a non-wage determinant shifts the entire market supply curve.

A stylised shift of market labour supply from S to S’ with demand held constant. In a labour context, the vertical axis is wage and the horizontal axis is labour. The rightward shift shows greater supply at every wage, for example due to immigration or improved job conditions. Source
Causes of Rightward Shifts (Increase in Supply)
Improved Training and Education: Expanding qualifications increases the pool of employable workers.
Migration and Demographic Changes: Inflows of workers raise supply.
Improved Working Conditions: Safer, more pleasant work attracts new entrants.
Government Policies: Tax incentives or subsidies for training can increase available labour.
Causes of Leftward Shifts (Decrease in Supply)
Falling Job Attractiveness: Poor conditions, limited promotion prospects, or declining industry reputation.
Demographic Trends: Ageing populations or declining birth rates can reduce the workforce.
Alternative Opportunities: Growth in more attractive occupations pulls workers away.
Barriers to Entry: Higher qualification requirements reduce the available pool of workers.
Diagrammatic Representation
A labour supply curve is upward sloping, showing that as wages rise, more workers are prepared to offer their services. Shifts of this curve represent changes in supply at all wage levels:
A rightward shift illustrates more workers are willing to work at each wage.
A leftward shift shows fewer workers are willing at each wage.
Interaction Between Monetary and Non-Monetary Factors
In real-world markets, both monetary and non-monetary factors interact to determine the overall supply of labour. For example, an occupation offering high wages but very poor conditions may struggle to maintain supply, whereas a moderately paid but rewarding occupation may attract significant numbers of workers.
This interaction highlights why wage alone is not a sufficient predictor of labour supply. The balance between financial incentives and non-financial satisfaction ultimately determines the shape and position of the labour supply curve.
Summary of Core Influences
Key elements influencing labour supply at the market level include:
Monetary Factors: Wages, bonuses, pensions, benefits.
Non-Monetary Factors: Job satisfaction, working conditions, flexibility.
Causes of Shifts: Training, migration, demographics, policy, attractiveness of work, alternative opportunities, and barriers to entry.
Together, these factors shape both the position and slope of the labour supply curve in different occupations, directly affecting employment outcomes and wage levels.
Practice Questions
Discuss two non-monetary factors that may cause the market supply of labour to shift. (6 marks)
Up to 2 marks for identifying relevant non-monetary factors (e.g., job satisfaction, working conditions, work–life balance, geographic location).
Up to 2 marks for explaining how each factor influences labour supply (e.g., poor conditions reduce supply, flexible hours increase supply).
1 mark for linking the factor explicitly to a shift of the supply curve (leftward or rightward).
1 mark for using appropriate economic terminology (e.g., “shift in labour supply curve” rather than “change in quantity supplied”).
Define the labour supply curve and explain what it shows at the market level. (3 marks)
1 mark for a clear definition: Labour supply curve shows the relationship between the wage rate and the number of workers willing to work in an occupation.
1 mark for recognising that the curve is upward sloping as higher wages encourage more workers to supply labour.
1 mark for identifying that this is shown at the market level, where all individual labour supplies are aggregated.
FAQ
The market labour supply curve represents the total number of workers willing to work in an occupation at different wage rates, combining all individual decisions.
An individual’s supply may bend backward at higher wages due to preference for leisure, but this complexity is not required at market level. The market curve smooths out these individual choices into a generally upward-sloping relationship.
Better education and training increase the pool of qualified workers available to an occupation. This expands the supply at all wage levels, shifting the curve rightward.
More workers meet entry requirements.
Existing workers can move into higher-skill roles.
Productivity gains may make certain jobs more attractive.
Migration can significantly change the size and composition of the labour force.
An inflow of skilled workers increases supply in sectors where demand is high, lowering upward wage pressures. Outflows, such as emigration of skilled workers, reduce labour supply, potentially shifting the curve leftward.
Ageing populations can reduce supply in physically demanding jobs as fewer older workers remain able to participate.
Conversely, rising numbers of younger workers may boost supply in entry-level or part-time roles. Demographic changes therefore alter the availability of labour across occupations, causing either leftward or rightward shifts in the supply curve.
If other industries offer higher pay or better conditions, workers may leave their current occupation.
This reduces the willingness of workers to stay, shifting the labour supply curve leftward. The effect is stronger in sectors with low job satisfaction or where skills are transferable across industries.
