
AQA Specification focus:
‘Students should be able to illustrate the misallocation of resources resulting from the consumption of merit and demerit goods using diagrams showing marginal private and social cost and benefit curves.’
Introduction
This section explores how merit and demerit goods cause resource misallocation when consumed, using diagrams with marginal private and social costs and benefits to show divergence.
Merit and Demerit Goods in Consumption
Merit Goods
Merit goods are products that society believes are under-consumed if left purely to the market. They generate positive externalities, meaning the social benefits exceed the private benefits. Examples include education and healthcare.
Merit Good: A good that is under-consumed in a free market because individuals do not fully perceive the social benefits of consumption.
Demerit Goods
Demerit goods are over-consumed in a free market because individuals ignore or underestimate the negative externalities of their use. These goods cause social costs greater than private costs. Examples include tobacco and junk food.
Demerit Good: A good that is over-consumed in a free market because individuals fail to account for the wider social costs of consumption.
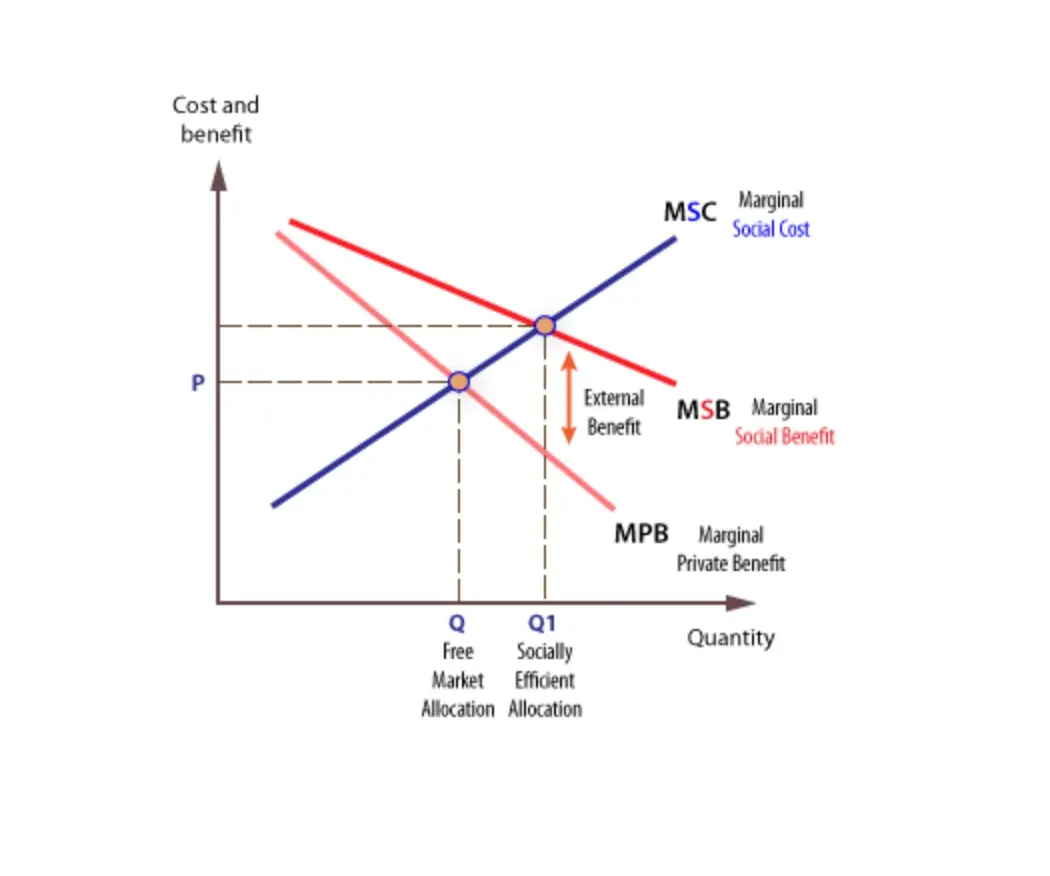
Private vs Social Benefits and Costs
Marginal Private Benefit (MPB): The benefit gained by consumers from consuming an extra unit.
Marginal Social Benefit (MSB): The total benefit to society, including private and external benefits.
Marginal Private Cost (MPC): The cost to an individual of consuming an extra unit.
Marginal Social Cost (MSC): The total cost to society, including private and external costs.
Misallocation occurs when MPB ≠ MSB or MPC ≠ MSC, creating a gap between private and social optima.
Merit Goods and Under-Consumption
Diagram Analysis
Free market equilibrium: Found where MPB = MPC.
Socially optimal equilibrium: Found where MSB = MSC.
With merit goods:
MPB < MSB.
Consumers undervalue the wider benefits.
Result: under-consumption compared to the socially desirable level.
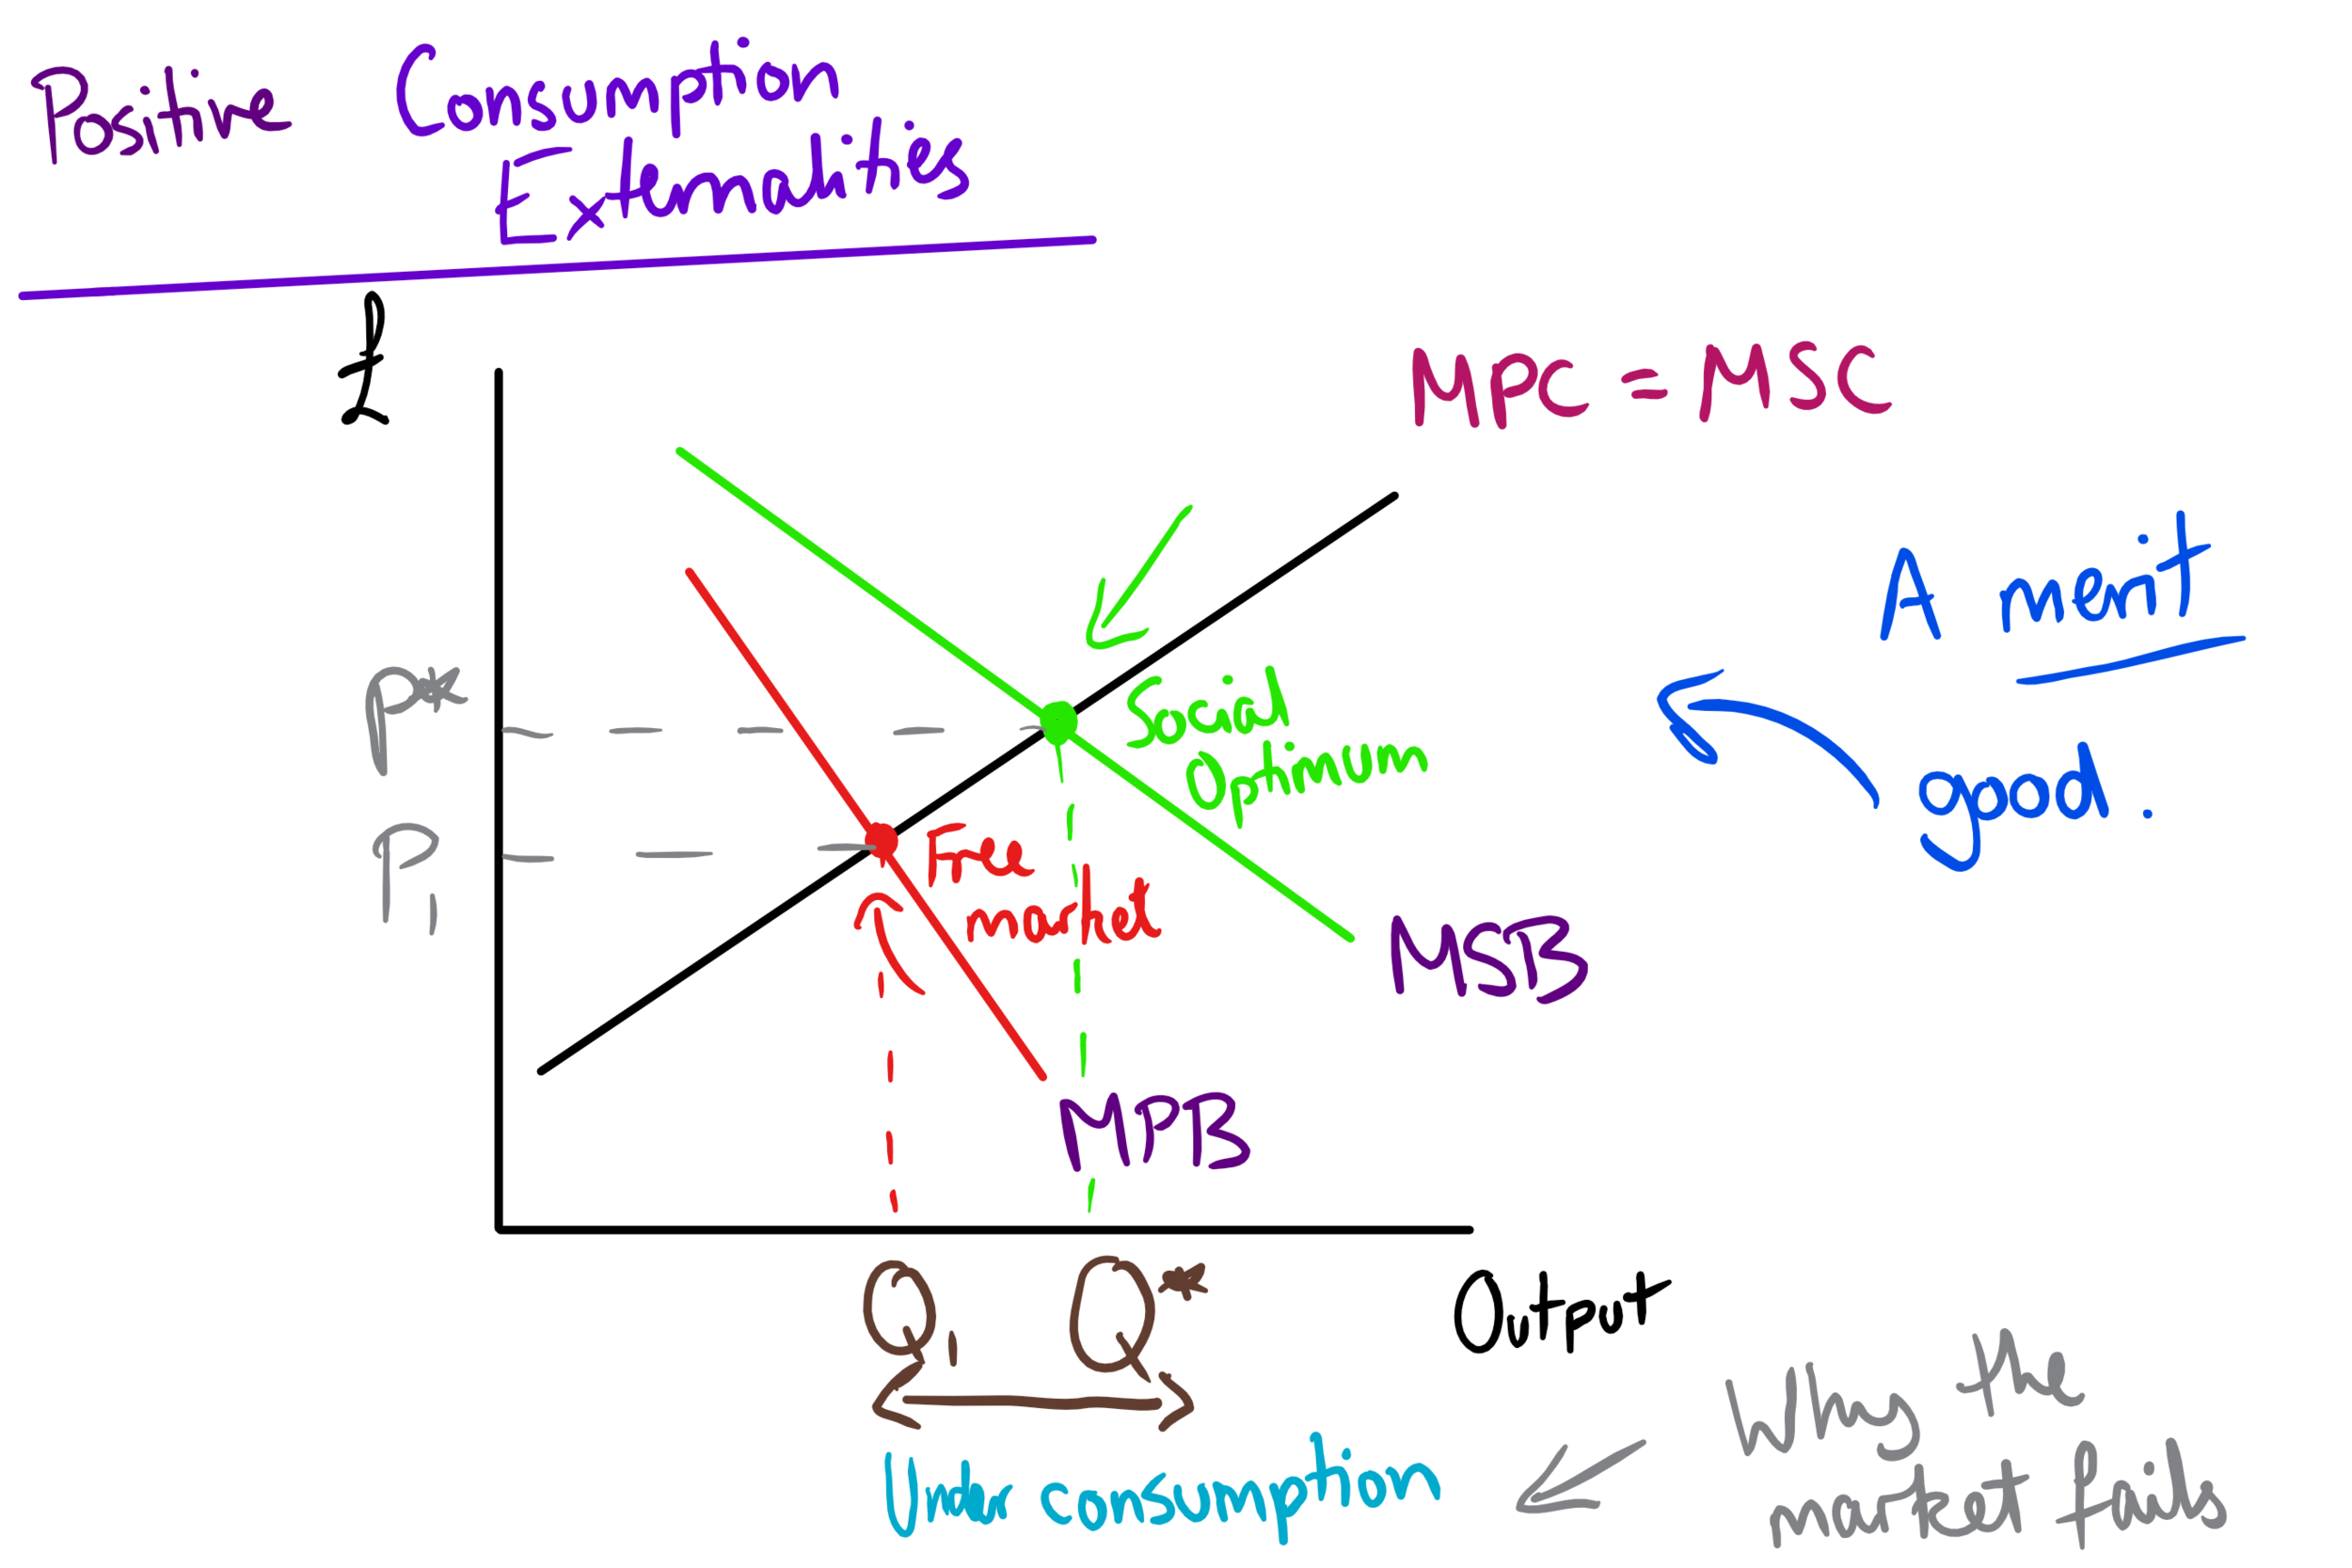
This diagram demonstrates the under-consumption of merit goods, where MPB is less than MSB, leading to a socially optimal output greater than the free market level. Source
Key Implications
The market under-provides merit goods.
This leads to welfare loss, as potential social benefits are missed.
Governments often intervene through subsidies, direct provision, or regulation.
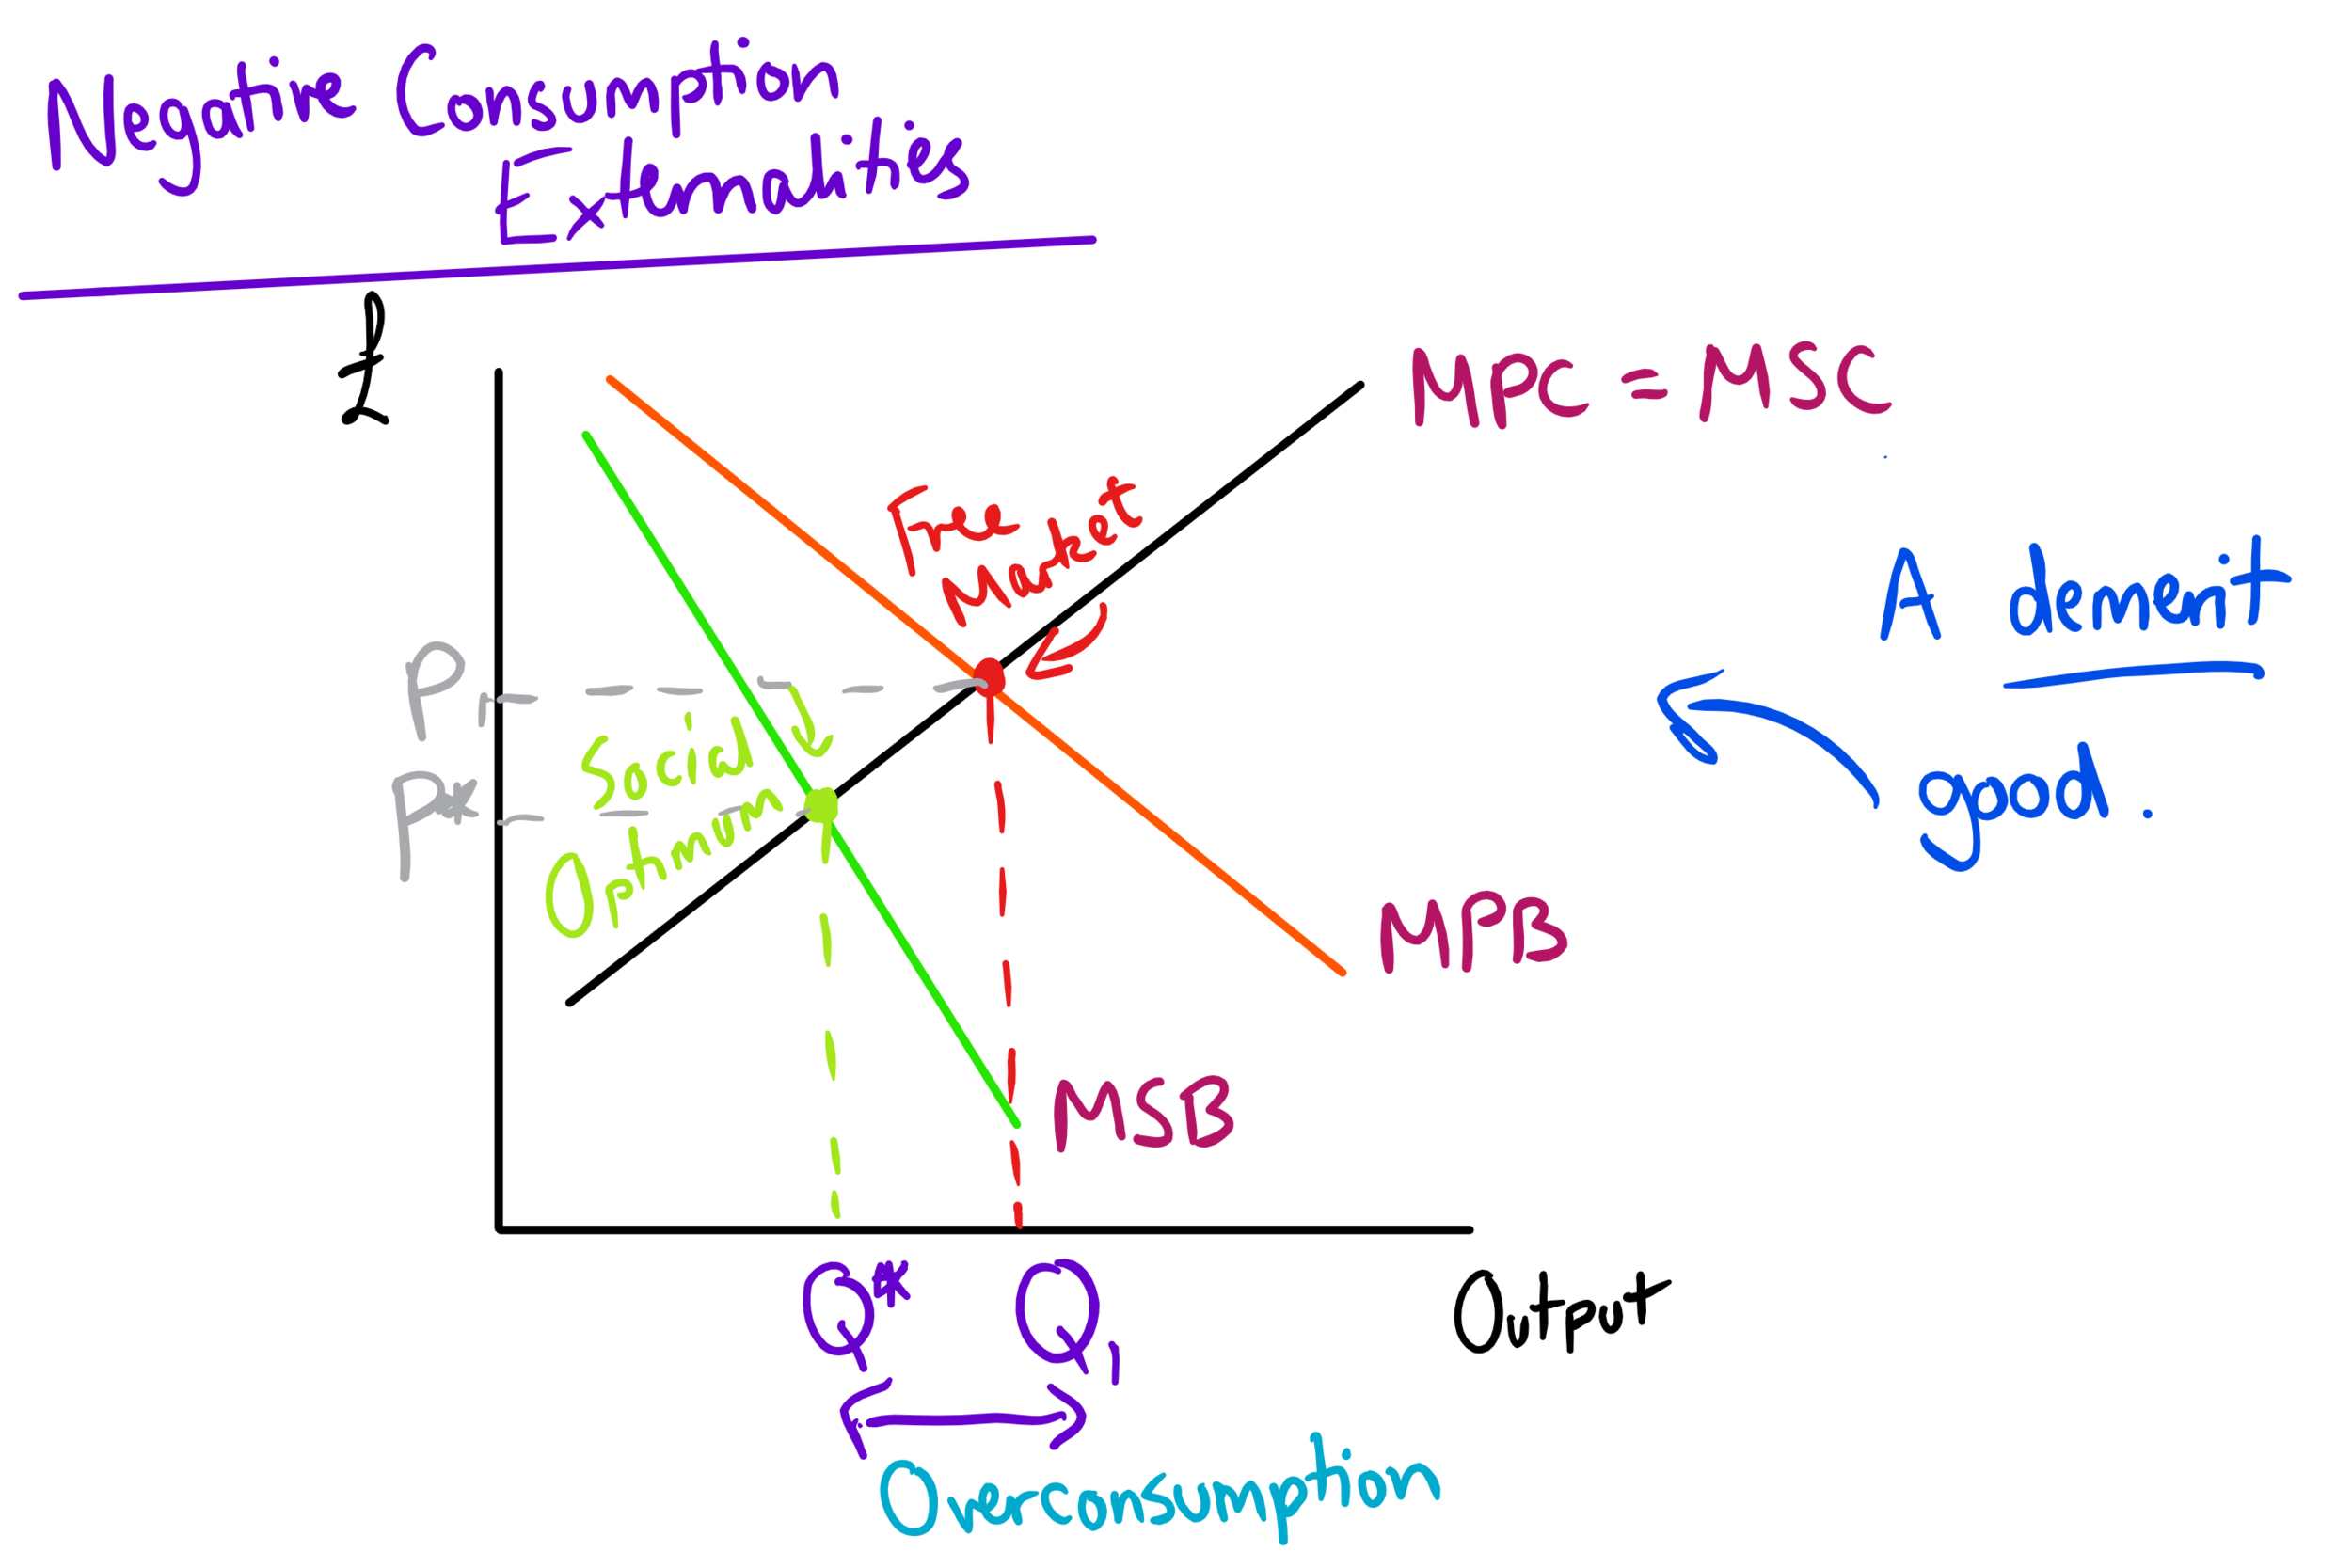
Demerit Goods and Over-Consumption
Diagram Analysis
Free market equilibrium: Found where MPB = MPC.
Socially optimal equilibrium: Found where MSB = MSC.
With demerit goods:
MPB > MSB.
Consumers ignore negative externalities.
Result: over-consumption compared to the socially optimal level.
This diagram illustrates the over-consumption of demerit goods, where MPB exceeds MSB, resulting in a free market quantity above the socially optimal level. Source
Key Implications
The market over-provides demerit goods.
This leads to deadweight welfare loss, as social costs outweigh private benefits.
Governments often address this using taxation, regulation, or awareness campaigns.
Welfare Loss and Misallocation
Merit Goods
Welfare loss occurs due to unrealised benefits from under-consumption.
The area between MSB and MPB curves, from the market equilibrium to the social optimum, illustrates the missed welfare.
Demerit Goods
Welfare loss occurs due to excessive consumption generating net social harm.
The area between MPB and MSB curves, from the social optimum to the market equilibrium, represents the over-consumption problem.
Role of Information Failures
Both merit and demerit goods involve imperfect information:
Consumers of merit goods undervalue benefits (e.g. long-term health from vaccinations).
Consumers of demerit goods underestimate harm (e.g. addiction risks from smoking).
This links to the concept of bounded rationality, where decision-making is limited by lack of knowledge or foresight.
Step-by-Step Diagram Breakdown
Merit Good Diagram
Draw demand as MPB and supply as MPC = MSC.
Add MSB curve above MPB to show external benefits.
Free market equilibrium occurs where MPB = MPC.
Socially optimal output occurs where MSB = MSC.
Show under-consumption gap and highlight welfare loss triangle.
Demerit Good Diagram
Draw demand as MPB and supply as MPC = MSC.
Add MSB curve below MPB to show external costs.
Free market equilibrium occurs where MPB = MPC.
Socially optimal output occurs where MSB = MSC.
Show over-consumption gap and welfare loss triangle.
Evaluation Points for Students
When analysing diagrams, students should consider:
The extent of divergence between private and social curves.
How large the welfare loss is relative to the market.
The role of government policy in correcting misallocation.
The possibility of government failure when interventions distort markets.
Practice Questions
Define a merit good and explain why it may be under-consumed in a free market. (2 marks)
1 mark: Correct definition of a merit good (a good that is under-consumed in a free market because individuals do not fully perceive its social benefits).
1 mark: Explanation that consumers undervalue benefits due to imperfect information, leading to lower consumption than the socially optimal level.
Using a diagram, explain how the consumption of a demerit good leads to welfare loss in a free market. (6 marks)
1 mark: Accurate diagram showing MPB above MSB with equilibrium at MPB = MPC.
1 mark: Identification of the socially optimal equilibrium at MSB = MSC.
1 mark: Correctly labelling Q1 as market output and Q2 as socially optimal output (with Q1 > Q2).
1 mark: Identification of the welfare loss triangle between MPB and MSB.
1 mark: Explanation that over-consumption occurs because private benefits are greater than social benefits.
1 mark: Clear link that this over-consumption creates deadweight welfare loss for society.
FAQ
Diagrams provide a clear visual of the divergence between private and social benefits, making it easier to see why misallocation occurs.
They also highlight the welfare loss triangle, which shows the real-world impact of under-consumption of merit goods or over-consumption of demerit goods.
By comparing market equilibrium with the socially optimal point, students can quickly grasp how government intervention might address the gap.
The welfare loss triangle shows the value of net benefits that society loses when consumption is not at the socially optimal level.
For merit goods: it represents the benefits society misses due to under-consumption.
For demerit goods: it represents the costs imposed on society from over-consumption.
It is shaded on the diagram between the MPB and MSB curves, illustrating inefficiency.
The difference between Marginal Private Benefit (MPB) and Marginal Social Benefit (MSB) explains why free markets may fail.
If MPB is lower than MSB, merit goods are under-consumed. If MPB is higher than MSB, demerit goods are over-consumed.
This divergence is the foundation of showing misallocation in AQA diagrams.
Yes, real-world examples strengthen analysis.
Merit goods: Vaccinations, where social health benefits exceed individual perceived benefits.
Demerit goods: Cigarettes, where social costs (NHS treatment, second-hand smoke) exceed individual private benefits.
These examples help in essays by showing how the diagrams apply outside theory.
Accuracy is essential. AQA mark schemes often award marks for clear labelling.
Curves: MPB, MSB, MPC, MSC.
Axes: Price and Quantity.
Equilibria: Market equilibrium (MPB = MPC) and Social optimum (MSB = MSC).
Welfare loss: Clearly shaded triangle with correct explanation.
Neat, simple, and fully labelled diagrams secure higher marks.
