
AQA Specification focus:
‘How index numbers are used to measure changes in the price level and changes in other economic variables.’
Index numbers are a vital tool in macroeconomics, allowing governments, businesses, and economists to track price movements and other economic variables in a standardised, comparable form.
Understanding Index Numbers in Context
Index numbers are statistical measures that show changes in a variable relative to a base period, usually set at 100. They are essential in analysing inflation, cost of living, and broader economic performance. When applied to prices, they enable economists to measure changes in the overall price level across time. Beyond prices, they can also track shifts in output, wages, or productivity.
Index Number: A statistical measure showing how a variable has changed over time compared to a base period, typically expressed relative to a base of 100.
By expressing data in this way, different variables can be compared more easily, and underlying trends become clearer than when looking at raw figures alone.
Tracking Prices with Index Numbers
The Role of Price Indices
The most common application of index numbers is in monitoring inflation. By tracking how a representative set of goods and services changes in cost, economists assess the price level.
Key examples:
Consumer Prices Index (CPI) — measures average price changes faced by households.
Retail Prices Index (RPI) — similar to CPI but includes housing costs like mortgage interest payments.
These indices help:
Gauge whether the economy is experiencing inflation or deflation.
Inform decisions on interest rates by the Bank of England.
Adjust wages, pensions, and benefits to maintain purchasing power.
Inflation: A sustained rise in the general price level of goods and services in an economy over a period of time.
Without price indices, identifying and comparing inflation trends would be far less precise.
How Indices Capture Price Movements
Indices are constructed using a basket of goods and services, designed to reflect typical household consumption. Each item in the basket is assigned a weight, representing its relative importance in consumer spending.
The process involves:
Selecting representative goods and services.
Gathering regular price data.
Applying weights to calculate an overall average change in prices.
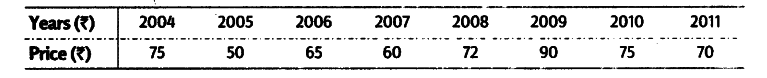
This table demonstrates the calculation of index numbers over multiple years, using 2004 as the base year. It shows how price changes are quantified and compared over time. Source
This ensures the index reflects not just price changes but also how significant each item is to consumer spending patterns.
Tracking Other Economic Variables
Index numbers are not limited to prices. They are widely applied in other areas of economics:
Wages: Tracking average earnings across time, showing changes in income levels.
Productivity: Measuring output per worker or per hour worked.
Trade: Monitoring export and import prices to calculate terms of trade.
Terms of Trade: The ratio of export prices to import prices, indicating how much imports a country can buy per unit of exports.
These applications demonstrate the flexibility of index numbers in highlighting economic performance beyond price inflation.
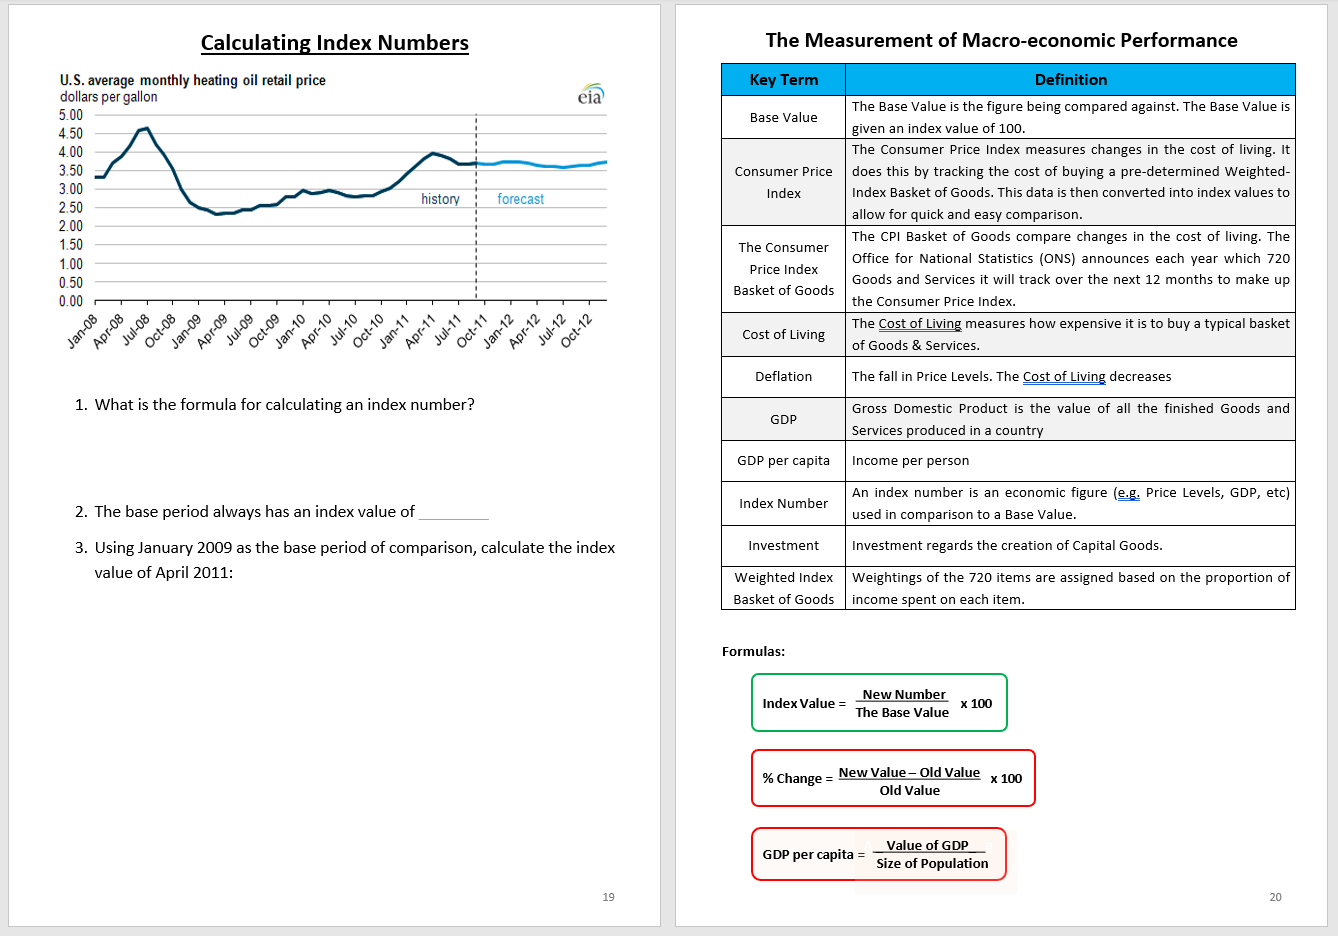
This worksheet presents scenarios for calculating index numbers, providing structured exercises to practise applying index number methodologies to real-world economic data. Source
Importance for Policymakers and Economists
Economic Policy Decisions
Governments and central banks rely on index numbers to:
Set monetary policy (e.g., interest rate changes to control inflation).
Assess wage demands in public sector negotiations.
Evaluate living standards and inequality trends.
Business and Investment Uses
Firms and investors use index numbers to:
Plan pricing strategies in response to inflation.
Forecast demand shifts linked to consumer incomes.
Assess competitiveness through wage and productivity indices.
Without these tools, decision-making would lack the necessary precision for effective economic management.
Potential Limitations of Using Indices
While invaluable, index numbers have limitations students must consider:
Substitution effect: Consumers may switch to cheaper alternatives, but indices may not fully capture this.
Quality changes: Improvements in goods may not be reflected in prices, distorting real value comparisons.
Representative issues: The “average household” may not reflect all groups, leading to bias.
Time lags: Data collection and reporting delays may reduce relevance in fast-changing economies.
These limitations remind us that indices are approximations rather than perfect measures.
Linking to the Specification
The AQA specification requires understanding of how indices are used to measure changes in the price level (such as inflation) and changes in other variables (such as wages and productivity). This knowledge enables students to interpret economic data critically and recognise how governments, firms, and households depend on index numbers for practical decisions.
Practice Questions
Define an index number and explain why a base year is used in its calculation. (2 marks)
1 mark for defining an index number: e.g. “A statistical measure showing how a variable changes over time relative to a base period set at 100.”
1 mark for explaining the role of the base year: e.g. “The base year provides a point of comparison against which all other years’ data can be measured.”
Explain how index numbers are used to track changes in the price level and discuss one limitation of using them to measure inflation. (6 marks)
Up to 2 marks for explaining that index numbers are used to measure changes in the price level, e.g. “They summarise changes in the cost of a basket of goods and services.”
Up to 2 marks for linking to inflation: e.g. “An increase in the index number over time indicates inflation, while a fall indicates deflation.”
Up to 2 marks for discussing one limitation:
Substitution effect (consumers switch to cheaper alternatives, not fully reflected).
Quality changes (improvements may not show in price data).
Representativeness (the ‘average basket’ may not apply equally to all households).
Maximum 6 marks: Level of detail and accuracy in explanation and limitation determines full credit.
FAQ
Weights ensure that more significant items in household spending have a greater influence on the index. For example, housing costs usually carry more weight than clothing.
Without weights, minor goods would distort the index, making it less reflective of real consumer spending. Weights are updated periodically to reflect changes in spending patterns.
The Office for National Statistics (ONS) updates the CPI monthly, using data from thousands of shops and online retailers.
The basket of goods is reviewed annually to ensure it reflects current consumption habits, adding new items (e.g. streaming subscriptions) and removing outdated ones.
Index numbers themselves cannot be negative, since they are expressed relative to a base year set at 100.
However, the rate of change in an index can be negative, indicating falling prices or deflation over a given period.
A simple index treats all items equally, giving each the same importance.
A weighted index assigns importance according to how much households spend on each item.
Weighted indices are generally more accurate for measuring inflation, as they better represent actual consumption.
Each country constructs its index using a basket of goods that reflects its own consumption habits.
For example, food may have a higher weight in one country, while transport may dominate in another. This difference in weights explains variation in reported inflation rates.
