
AQA Specification focus:
‘The use and limitations of national income data to assess changes in living standards over time.’
Introduction
Measuring living standards over time is central to macroeconomics, but interpreting changes through national income data involves both useful insights and significant limitations.
Understanding National Income Data
Real GDP and Living Standards
The most widely used measure of living standards over time is real Gross Domestic Product (GDP). This represents the total value of goods and services produced in an economy, adjusted for inflation. Economists often assume that rising real GDP reflects improving living standards because more goods and services are available for consumption.
GDP per Capita
To make comparisons over time meaningful, economists use real GDP per capita, which divides GDP by the population size. This indicates the average income or output per person and helps account for population growth when evaluating living standards.
Using National Income Data to Assess Living Standards
Advantages of Using National Income Data
National income statistics provide several important benefits when tracking living standards:
Consistency: GDP is calculated using standardised methods, allowing comparisons across years.
Quantifiable growth: Changes in real GDP per capita highlight whether the average citizen is better or worse off materially.
Indicator of resources: Higher GDP suggests greater resources for public services, infrastructure, and welfare.
Long-term trends: Decade-by-decade data can reveal whether living standards are rising steadily, stagnating, or falling.
The Link to Welfare
Although not perfect, GDP provides a proxy for material welfare — the goods and services available to households. A sustained increase in GDP per capita usually signals higher average incomes, improved housing, and better access to healthcare and education.
Limitations of National Income Data
Despite its usefulness, GDP has serious drawbacks as a measure of living standards.
Exclusion of Non-Market Activity
Many valuable activities are not recorded in GDP because they lack a market price:
Household production such as childcare or cooking.
Voluntary work, which contributes to welfare but is unpaid.
This exclusion means that measured GDP underestimates the real contribution to living standards.
Informal and Black Markets
Economic activity in the informal sector or black market is often substantial but unrecorded. In economies with large informal sectors, official GDP figures may significantly understate total living standards.
Income Distribution
Rising GDP per capita does not guarantee improvements for all citizens. If income growth is concentrated among the wealthy, living standards for the majority may stagnate or fall.
Income Distribution: The way in which national income is shared among individuals or households in an economy.
Unequal distribution can therefore mask deteriorating living standards for significant groups within society.
Quality of Goods and Services
National income statistics measure quantity but struggle to capture quality improvements. Advances in technology, healthcare, and education may improve welfare without proportional increases in GDP.
Environmental Costs
Increases in GDP may coincide with environmental damage, resource depletion, and pollution, which reduce well-being. Living standards may appear higher in national accounts, while actual quality of life deteriorates.
Leisure and Working Hours
GDP measures output but ignores changes in leisure time. If growth results from longer working hours, people may have less time for rest and family life, undermining welfare.
External Shocks and Sustainability
Short-term rises in GDP might reflect unsustainable practices such as overusing natural resources or excessive borrowing. Long-term living standards could be at risk even while GDP temporarily rises.
Adjustments and Complementary Measures
Real GDP vs. Nominal GDP
Economists stress the importance of using real GDP, which adjusts for inflation, rather than nominal GDP. This ensures that changes in living standards reflect actual increases in output, not just rising prices.
Real GDP: The total value of all goods and services produced in an economy, adjusted for inflation.
GDP per Capita in Context
While real GDP per capita is more accurate than aggregate GDP, it still requires careful interpretation:
A rising average may hide inequalities.
Population composition (e.g., ageing or migration trends) may distort the meaning of per capita measures.
Alternative Indicators
To address limitations, economists often use complementary measures such as:
Human Development Index (HDI), which combines income with education and life expectancy.
Genuine Progress Indicator (GPI), which adjusts GDP for environmental and social costs.
Subjective well-being surveys, which assess happiness and satisfaction levels directly.
Historical Shifts in Living Standards
Tracking living standards over time with GDP highlights key historical patterns:
Post-war boom: Sustained increases in GDP reflected rapid improvements in material welfare across many advanced economies.
Stagflation of the 1970s: Rising prices and unemployment weakened the link between GDP growth and improved living standards.
Recent decades: Growth in GDP has often coincided with concerns about inequality and environmental sustainability, demonstrating the limits of GDP-focused analysis.
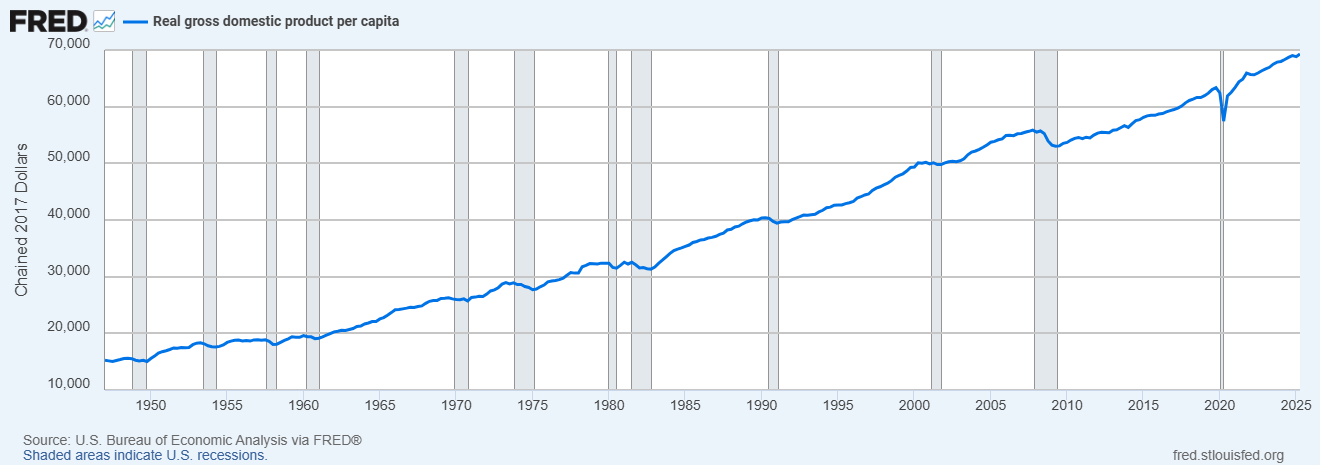
This chart displays the inflation-adjusted real GDP per capita in the United States from 1947 to 2025, showcasing periods of economic expansion and contraction. It provides context for understanding how national income data reflects changes in living standards over time. Source
Final Considerations
National income data, particularly real GDP per capita, remains a vital tool for measuring changes in living standards over time. However, its limitations — including issues of distribution, quality, environmental impact, and non-market activities — mean it must be interpreted with caution and supported by broader measures of welfare.
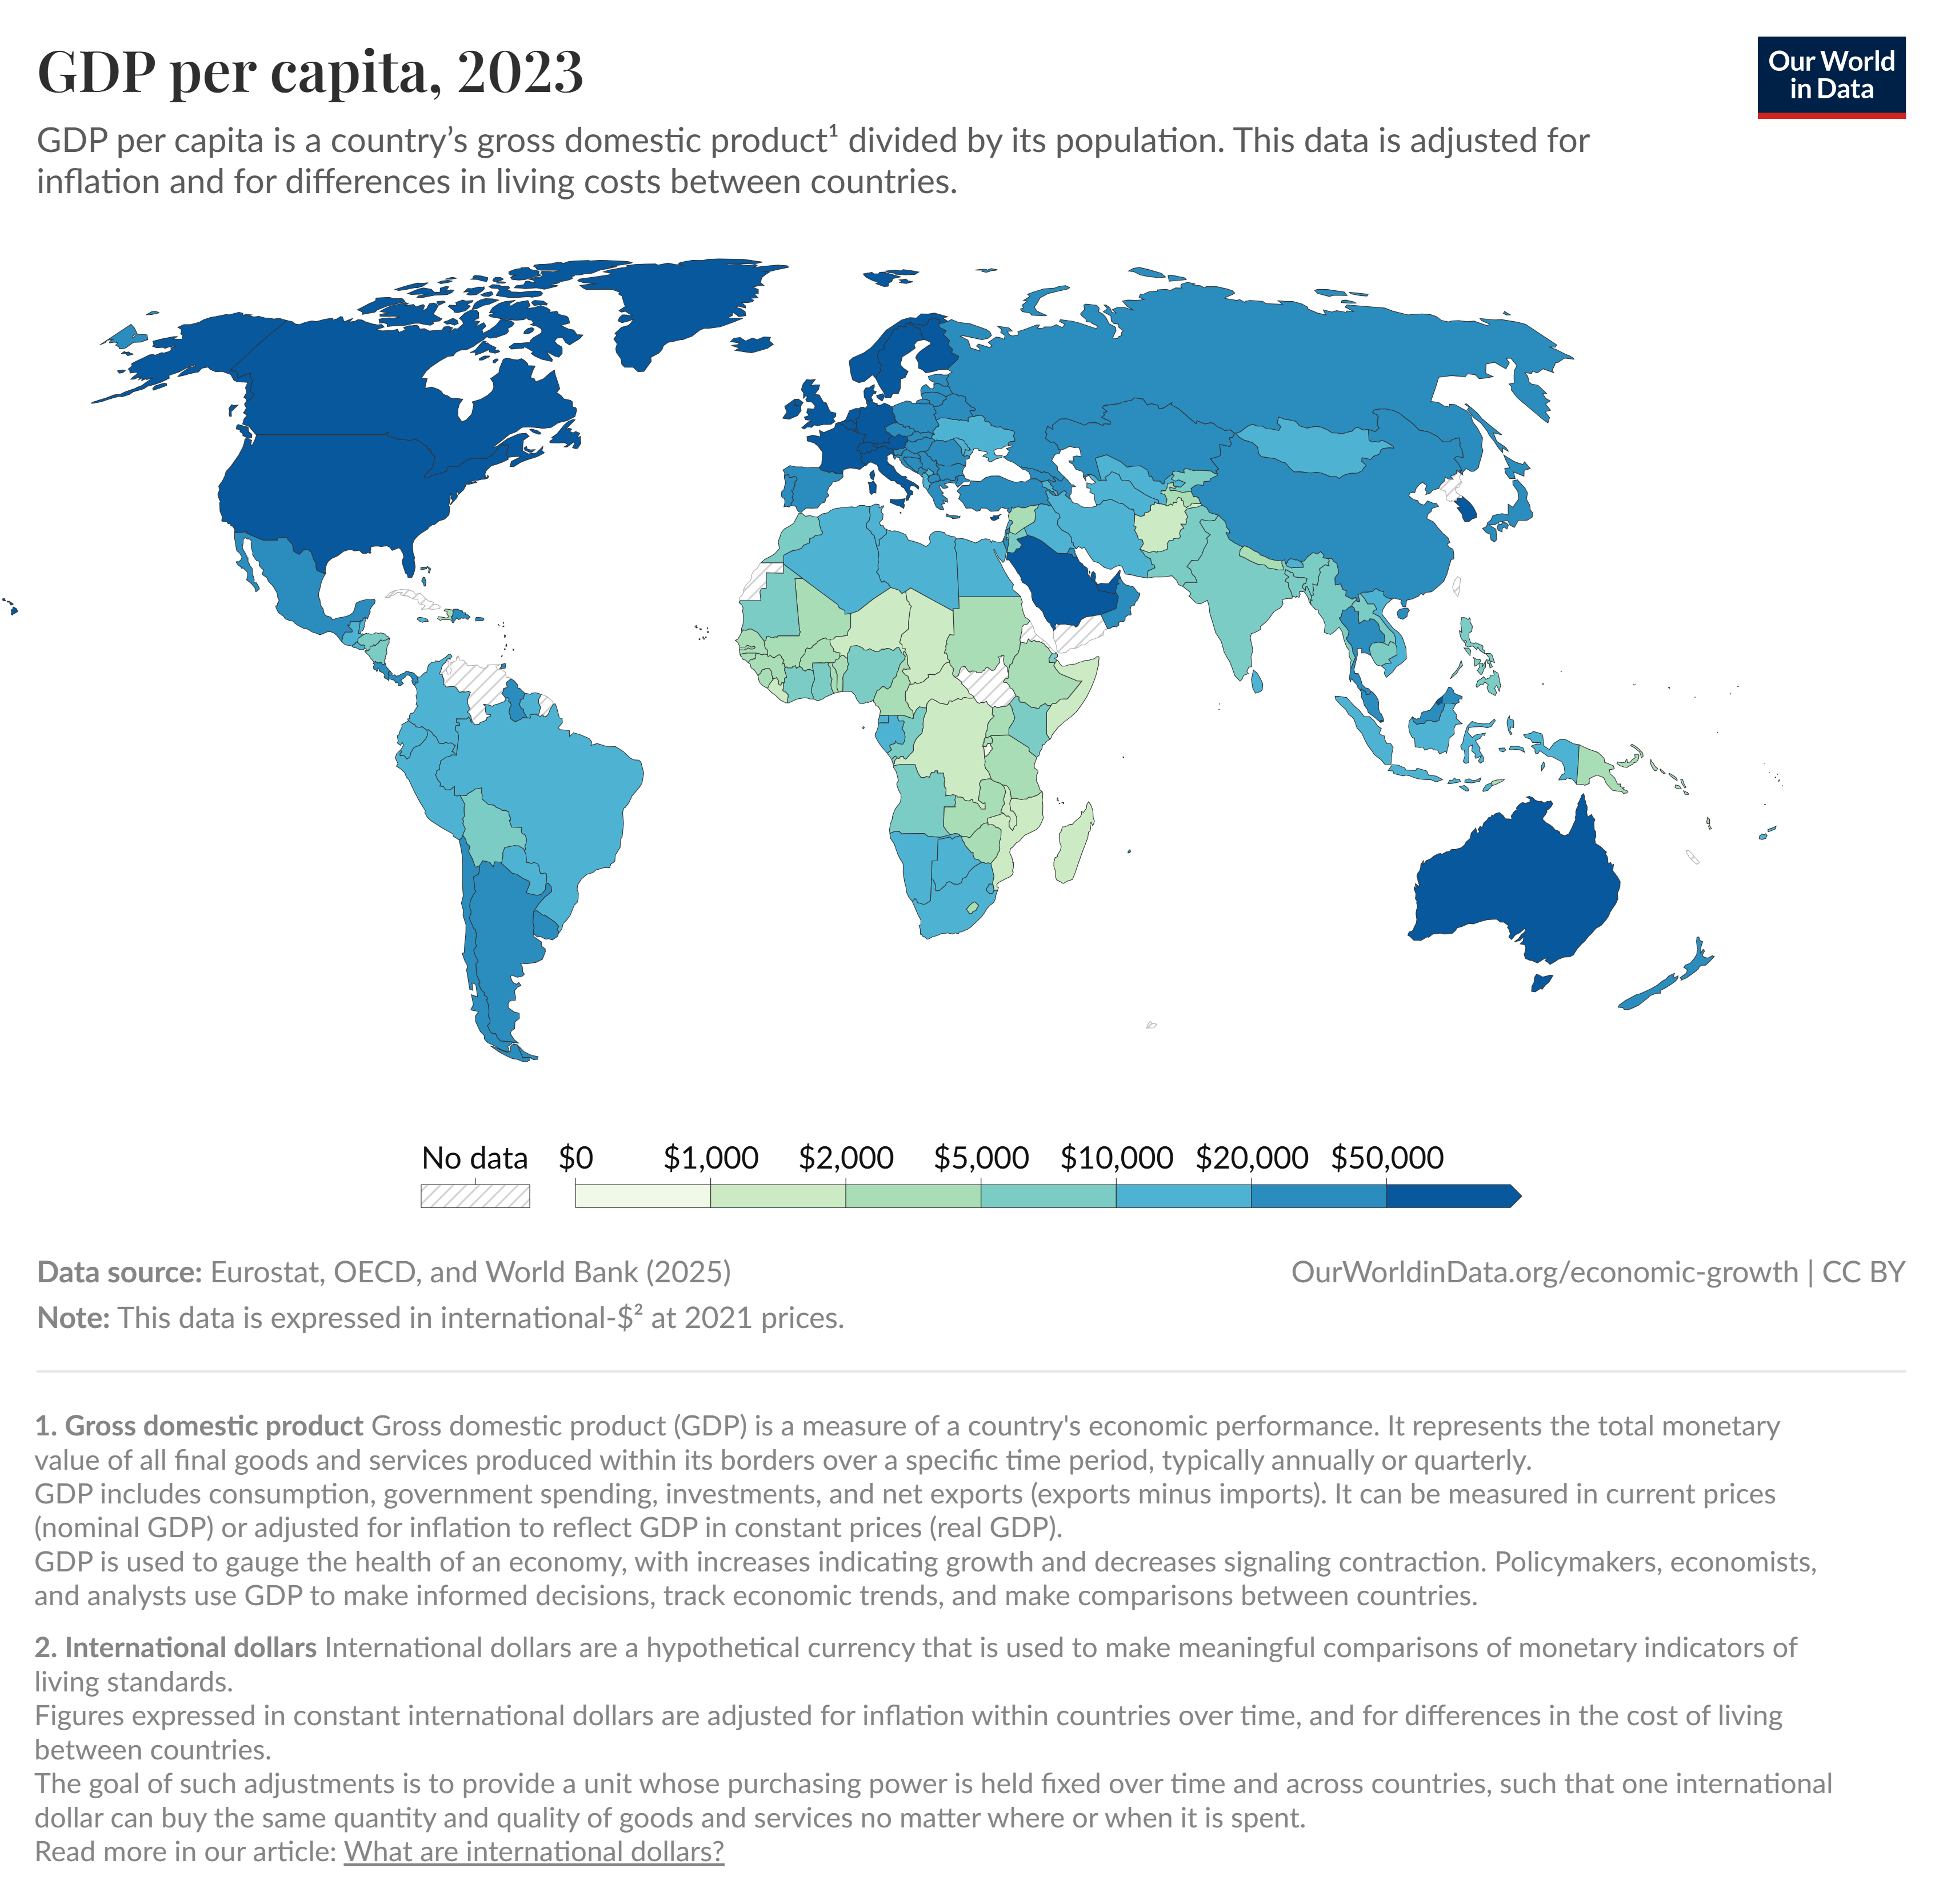
This map presents the GDP per capita by country for 2023, adjusted for purchasing power parity. It highlights the economic disparities between nations, emphasizing the need for caution when comparing living standards across countries using national income data. Source
Practice Questions
Define real GDP per capita and explain why it is used to measure changes in living standards over time. (2 marks)
1 mark for a correct definition of real GDP per capita (total value of goods and services produced, adjusted for inflation, divided by population).
1 mark for explaining why it is used (provides an average measure of output or income per person, useful for assessing material living standards over time).
Discuss two limitations of using real GDP per capita as a measure of changes in living standards over time. (6 marks)
Up to 2 marks for identifying each limitation (max 4 marks):
Does not account for income distribution (e.g., rising GDP may benefit only the wealthy).
Ignores non-market activities such as household production and voluntary work.
Excludes environmental and social costs (e.g., pollution, resource depletion).
Fails to capture changes in leisure time or quality of goods and services.
Up to 1–2 marks for analysis/development of each limitation (e.g., explaining how ignoring inequality could give a misleading picture of average welfare).
Maximum 6 marks overall.
FAQ
If GDP grows at the same rate as population, GDP per capita remains unchanged, suggesting no improvement in average living standards. Rapid population growth can therefore mask actual economic progress.
Conversely, if GDP rises faster than population, GDP per capita increases, reflecting genuine gains in material welfare. Demographic shifts, such as ageing populations, may also affect how improvements are distributed.
GDP per capita focuses on material output but does not capture non-material aspects of welfare. Subjective surveys measure factors like life satisfaction, happiness, and social trust.
These aspects reflect individual experiences more directly and may highlight disparities hidden by GDP. For example, two economies with identical GDP levels may show very different well-being outcomes due to differences in health, security, or community support.
If inflation is high, nominal GDP may rise even though real output and living standards remain stagnant. This can give a misleading impression of progress.
Adjusting for inflation through real GDP ensures changes reflect actual increases in goods and services, not just price rises. Long-term comparisons are only meaningful when expressed in constant prices.
GDP growth often counts activities that damage the environment, such as deforestation, mining, or heavy industry, as positive contributions to output.
However, these activities may reduce welfare over time by:
Polluting air and water
Depleting natural resources
Increasing health risks
Thus, short-term rises in GDP may coincide with falling long-term living standards.
GDP does not account for how much leisure time people have, even though leisure contributes significantly to welfare.
If GDP growth comes from longer working hours, people may experience less rest, reduced family time, and lower overall satisfaction.
A country with slower GDP growth but more leisure could arguably have higher living standards than one with faster growth but longer working hours.
