
AQA Specification focus:
‘The use and limitations of national income data to compare differences in living standards between countries.’
Comparing living standards across nations is central to macroeconomics. While national income data provides valuable insights, it also has significant limitations when applied internationally.
Cross-Country Comparisons Using National Income Data
GDP and GDP per Capita
The most common measure for comparing living standards across countries is Gross Domestic Product (GDP), adjusted to GDP per capita. This helps account for differences in population size and offers a proxy for average income and consumption levels.
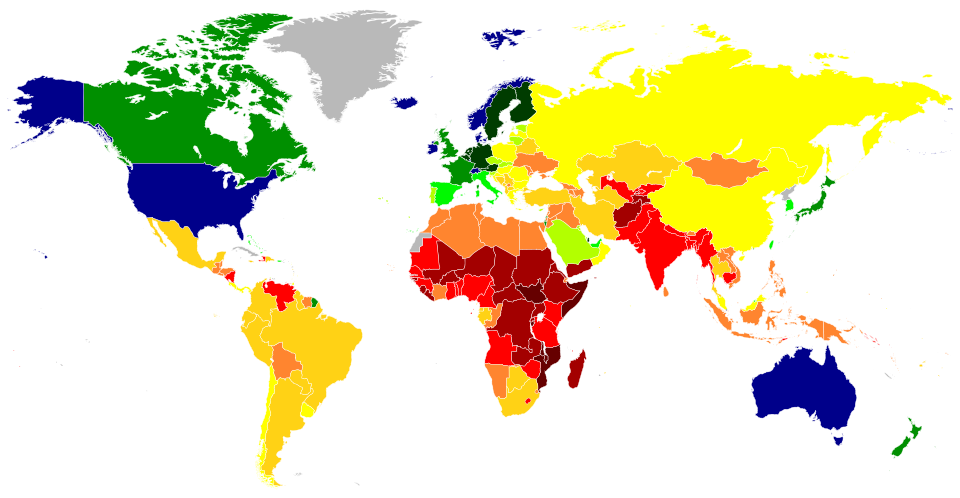
This map illustrates the nominal GDP per capita by country for 2021, highlighting economic disparities. Note that nominal GDP does not account for cost of living differences. Source
GDP per capita: GDP divided by the total population, providing an average income per person within a country.
However, GDP per capita is an imperfect measure of well-being, as it does not capture the distribution of income, quality of life, or non-market activities.
Strengths of Using National Income Data
Standardisation of Measurement
Most countries compile national accounts following internationally agreed guidelines, such as the System of National Accounts (SNA). This allows for some degree of comparability across nations.
Quantitative Comparisons
National income data provides numerical indicators, enabling economists and policymakers to:
Rank countries by size of economy.
Compare growth rates.
Estimate average material living standards.
Tracking Progress
Cross-country GDP comparisons are useful in analysing convergence or divergence in economic development. For example, developing countries can be tracked to see if their living standards are catching up with developed nations.
Limitations of Using National Income Data
Differences in Data Collection
Countries may have different statistical capacities, resulting in varying accuracy. Developing economies often struggle with incomplete or outdated data, reducing reliability in international comparisons.
Exchange Rate Problems
When comparing across countries, GDP is typically converted into a common currency, often US dollars. Exchange rate fluctuations can distort comparisons, especially if the nominal exchange rate does not reflect underlying purchasing power.
Purchasing Power Parity (PPP) and Its Role
To overcome exchange rate issues, economists use Purchasing Power Parity (PPP).
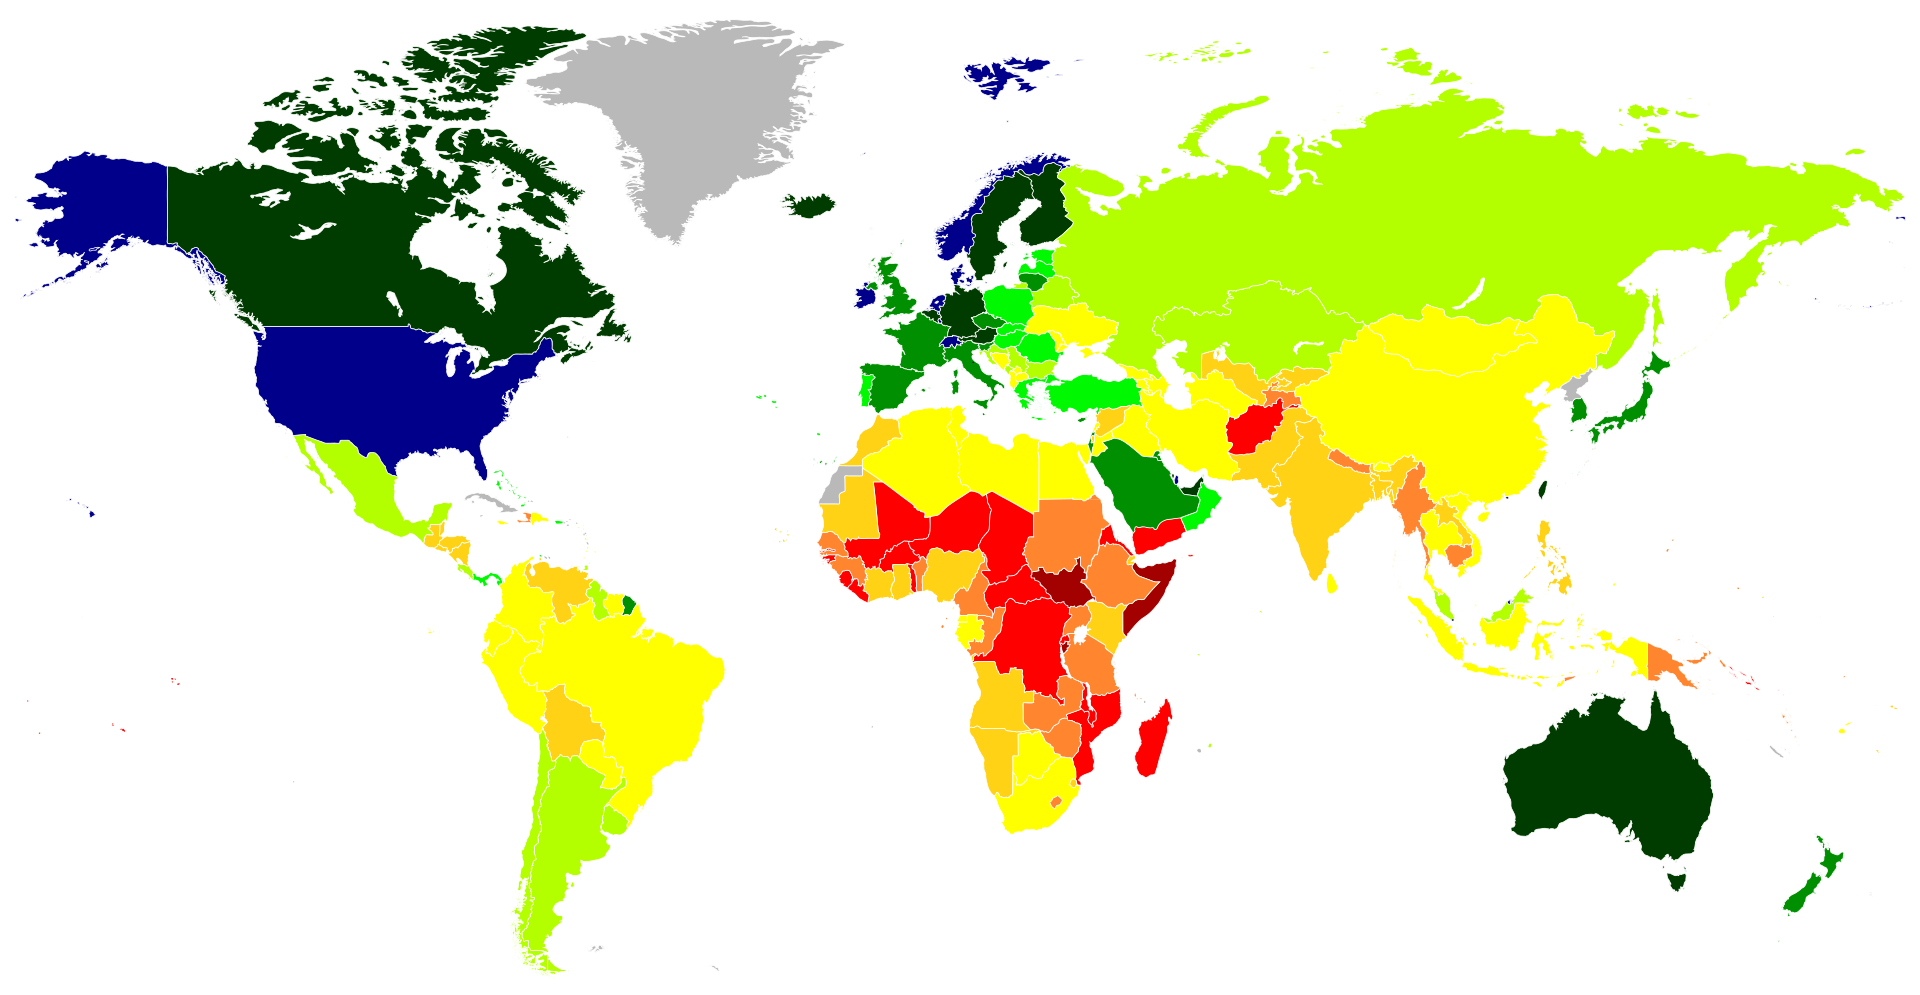
This map displays GDP per capita adjusted for purchasing power parity across countries in 2021, offering a more accurate comparison of living standards by accounting for cost of living differences. Source
Purchasing Power Parity (PPP): An exchange rate adjustment that equalises the purchasing power of different currencies by accounting for the relative cost of a standardised basket of goods and services.
PPP-adjusted GDP per capita allows for more meaningful comparisons of living standards, as it considers differences in price levels between countries.
Beyond GDP: Non-Monetary Aspects of Living Standards
Income Distribution
GDP per capita is an average measure and does not account for inequality. A country with high GDP per capita may still have widespread poverty if wealth is concentrated.
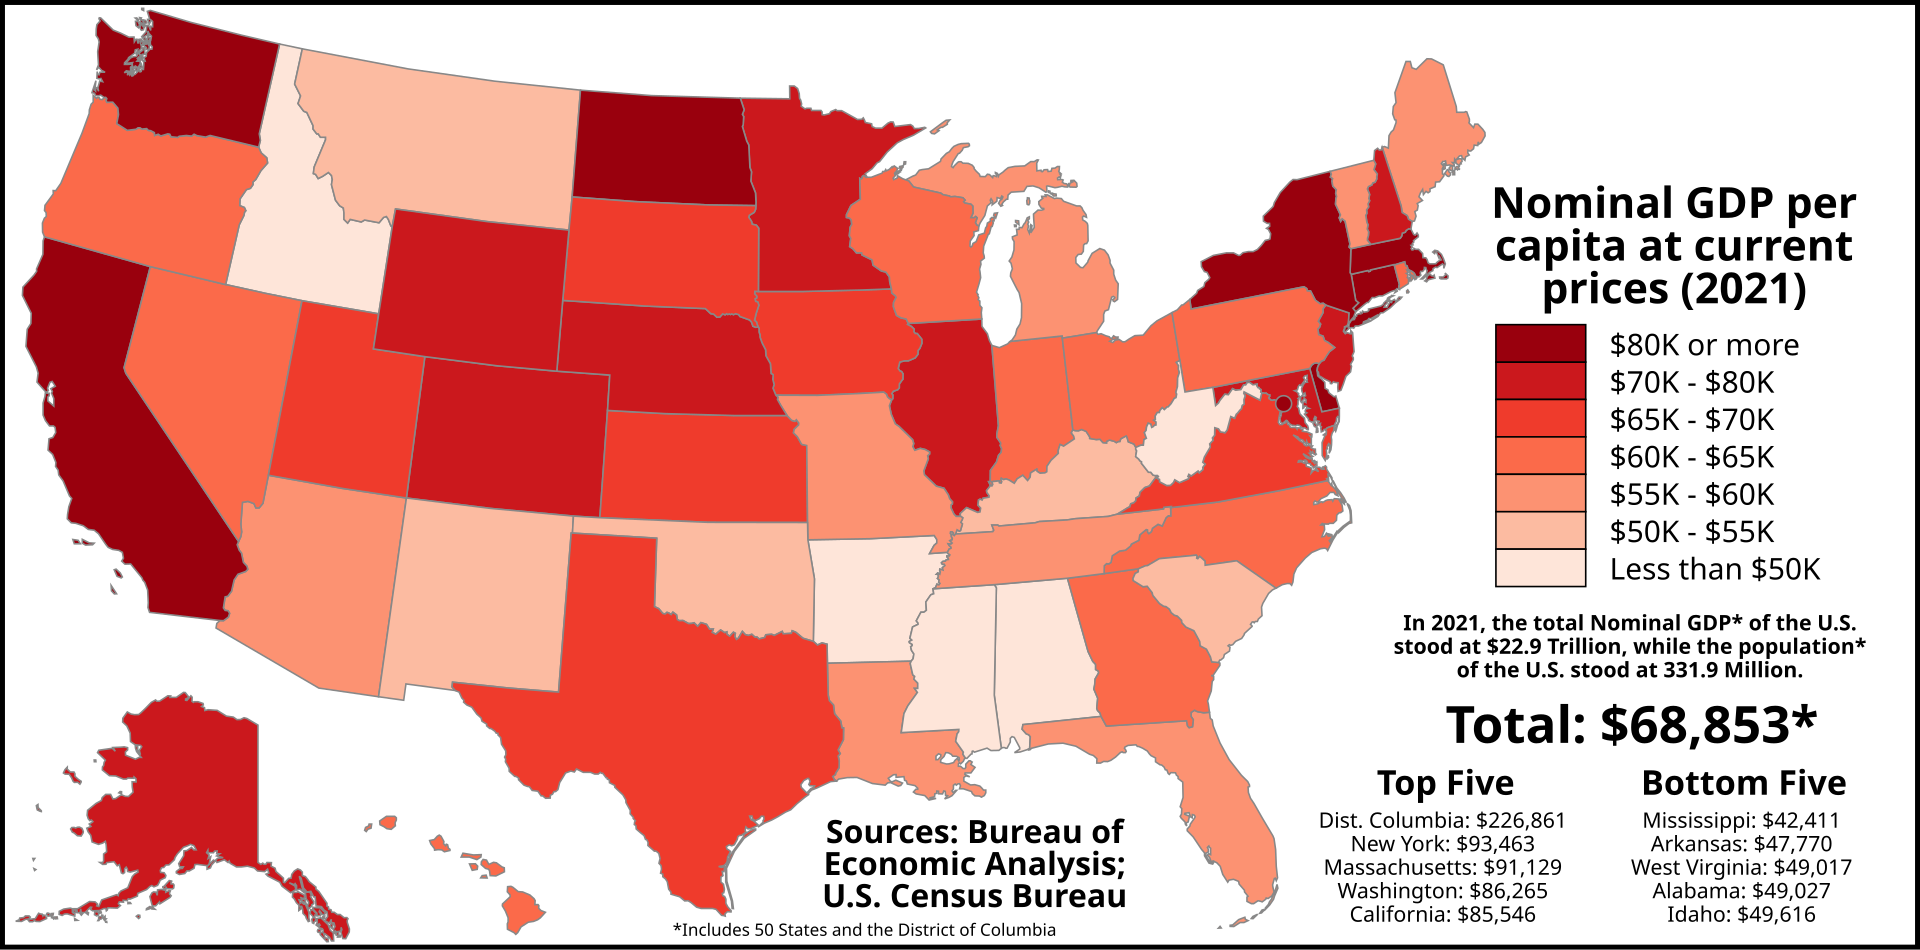
This map shows the nominal GDP per capita across U.S. states in 2021, highlighting significant regional economic disparities within a single country. Source
Informal and Non-Market Activity
In many developing countries, large amounts of production occur outside formal markets, such as subsistence farming. These activities are not recorded in GDP, underestimating true living standards.
Quality of Life Factors
National income data excludes qualitative aspects such as:
Health outcomes (life expectancy, infant mortality).
Education levels (literacy rates, years of schooling).
Environmental quality (pollution levels, resource sustainability).
These indicators often diverge significantly from GDP-based measures of well-being.
Adjusting for Cost of Living Differences
PPP in Detail
Without PPP adjustments, two countries with identical GDP per capita might have very different living standards if price levels vary. For instance:
A higher cost of housing, healthcare, or food reduces real purchasing power.
PPP adjustments attempt to standardise comparisons by reflecting real affordability.
Real GDP per capita (PPP) = GDP per capita ÷ Price level index
GDP per capita = Nominal GDP ÷ Population
Price level index = Relative price levels compared to a base country (usually USA)
This adjustment provides a closer approximation of what individuals can actually consume.
Issues with PPP and Cross-Country Comparisons
While PPP improves accuracy, it still has limitations:
Constructing a comparable basket of goods across countries is difficult, as consumption patterns differ.
Data collection is resource-intensive and infrequent.
Informal economies are still underrepresented.
As a result, PPP data is more reliable in broad comparisons (e.g., OECD vs. developing countries) but less so for precise ranking.
Additional Indicators for International Comparisons
To overcome GDP’s limitations, economists use composite indicators alongside national income data:
Human Development Index (HDI) combines GDP per capita (PPP), life expectancy, and education levels.
Gini coefficient measures inequality, complementing GDP data.
Green GDP attempts to account for environmental degradation and sustainability.
These measures provide a richer picture of living standards but are still dependent on reliable statistical inputs, which vary across countries.
Changing Priorities Over Time
The importance of GDP comparisons has shifted. Policymakers increasingly stress well-being, sustainability, and inclusivity alongside income measures. Although national income data remains central, its use is now supplemented by broader social and environmental indicators in cross-country analysis.
Practice Questions
Explain one limitation of using GDP per capita to compare living standards between countries. (2 marks)
Identification of a limitation (1 mark).
Brief explanation of why this is a limitation (1 mark).
Examples:Does not account for inequality (1). Higher GDP per capita could still hide widespread poverty if income is unevenly distributed (1).
Fails to include non-market activity (1). Subsistence farming and informal work are excluded, so true living standards may be underestimated (1).
Discuss the usefulness and limitations of using Purchasing Power Parity (PPP) adjusted GDP per capita when comparing living standards across countries. (6 marks)
Clear explanation of PPP and its purpose (1–2 marks).
Explanation of how PPP improves comparisons by accounting for cost of living differences (1–2 marks).
Identification of limitations, such as difficulty in constructing comparable baskets of goods, infrequent data collection, or underestimation of informal activity (1–2 marks).
Balanced discussion covering both usefulness and limitations (rewarded for analysis and evaluation) (up to 2 marks).
Indicative content:
PPP provides more meaningful comparisons as it reflects real purchasing power.
Improves cross-country analysis by removing distortions from exchange rate fluctuations.
However, it is resource-intensive, not updated frequently, and still subject to measurement errors.
Conclusion may recognise PPP is better than nominal GDP but not perfect for international comparisons.
FAQ
GDP per capita only measures average income and does not capture broader welfare. Two countries might have similar figures, but:
One may have better healthcare, education, or infrastructure.
Levels of inequality could differ, meaning wealth is shared unevenly.
Social and cultural factors, such as security or work–life balance, also influence quality of life.
In developing countries, a large proportion of work occurs outside formal markets, such as subsistence farming or cash-based services. These are rarely recorded in GDP.
This underreporting makes comparisons with countries where most activity is formal less reliable, as living standards may appear lower than they truly are.
If GDP is converted into a common currency using nominal exchange rates, temporary fluctuations can distort comparisons.
A depreciation of one currency might make living standards look worse than they actually are, while an appreciation could exaggerate prosperity. PPP adjustments are designed to reduce this issue.
The reliability of data depends on a country’s statistical capacity. Developed nations often produce frequent, detailed accounts, while developing economies may face resource limitations.
Unreliable or outdated data reduces the accuracy of comparisons, especially when measuring progress over time or between countries at different stages of development.
Composite measures combine economic and social indicators to give a fuller picture of living standards.
HDI adds education and life expectancy alongside income.
The Gini coefficient highlights inequality missed by GDP.
Environmental indicators capture sustainability concerns.
These provide more nuanced comparisons, though they still rely on reliable data collection.

_per_capita_in_2021.svg)
_per_capita_in_2021.svg)