
AQA Specification focus:
‘Quantitative and qualitative skills including mass balance, unit conversions, analysis and presentation of field data.’
AQA A-Level geography requires students to use both qualitative and quantitative skills to explore the water and carbon cycles using appropriate data analysis and fieldwork techniques.
Quantitative and Qualitative Skills Overview
Students must demonstrate proficiency in data collection, analysis, and presentation, integrating both numerical (quantitative) and descriptive (qualitative) methods. This includes interpreting information related to mass balance, converting between units, and working with field data to understand hydrological and carbon-related processes.
Quantitative Skills
Quantitative skills involve working with numbers to understand physical geography processes.
Unit Conversions
Students must be able to convert between different units, especially when working with hydrological and carbon data.
Common unit conversions include:
Millimetres (mm) to metres (m)
Cubic metres (m³) to litres (L)
Gigatonnes (Gt) to kilograms (kg)
Seconds (s), minutes (min), hours (h), days (d) for rate measurements
Mastering unit conversions ensures consistency when comparing data from multiple sources.
Mass Balance
Mass balance refers to the comparison between the inputs and outputs of a system, ensuring conservation of mass.
Mass Balance: A calculation used to determine whether inputs and outputs in a natural system are equal, often applied to drainage basins and glacial systems.
Water Balance (P) = Q + E ± ΔS
P = Precipitation (mm or m³)
Q = Runoff or streamflow (mm or m³)
E = Evapotranspiration (mm or m³)
ΔS = Change in storage (soil moisture, groundwater)
A positive water balance indicates more water entering than leaving; a negative balance means outputs exceed inputs, which may affect river discharge and groundwater levels.
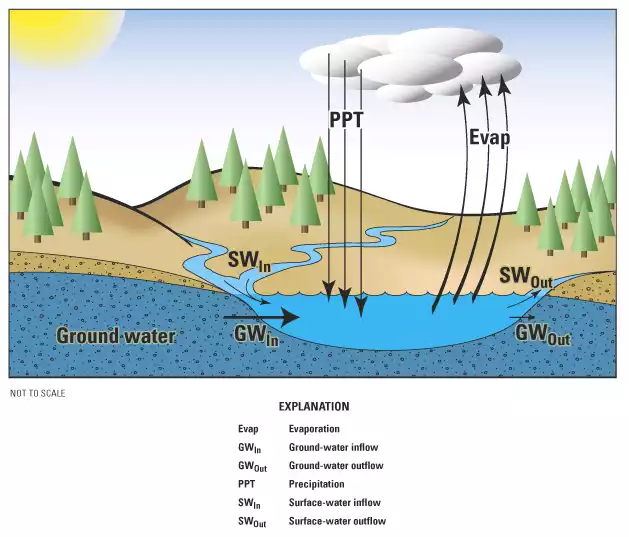
This diagram shows the hydrologic balance of a lake, with arrows for precipitation (PPT), evaporation (Evap), surface‐water inflow/outflow (SW/SWₘₓₜ) and groundwater inflow/outflow (GW/GWₘₓₜ). It highlights how mass‐balance principles quantify net storage changes in natural systems. Source
Working with Field Data
The AQA specification expects students to collect, analyse, and present field data related to the water and carbon cycles.
Field Data Collection Methods
Water cycle data collection might include:
Rain gauges to measure precipitation
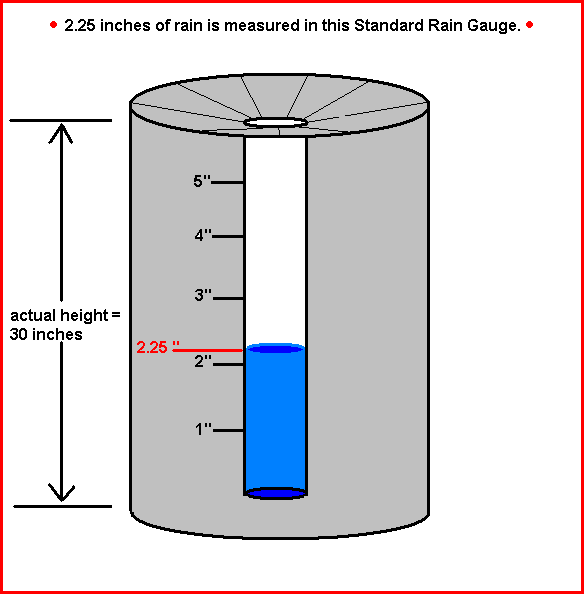
This diagram illustrates a standard cylindrical rain gauge with a funnel-shaped receiver and internal graduated cylinder; the red line shows how 2.25 inches of rainfall are recorded against a 30 inches-high outer container. It demonstrates how precipitation depth is measured simply and accurately. Source
Flow metres to assess river discharge
Soil moisture probes to determine infiltration rates
Evaporation pans for evaporation estimates
Carbon cycle data collection might include:
Leaf area index (LAI) to estimate photosynthetic potential
Soil carbon content sampling
Biomass surveys using quadrats and transects
Fieldwork data must be representative, reliable, and recorded systematically.
Data Analysis
Students should be able to analyse spatial and temporal patterns from field data. Key analysis techniques include:
Descriptive statistics (mean, median, mode, range)
Percentage change and rate of change
Correlation analysis to explore relationships (e.g., between vegetation cover and interception rates)
Use of software (e.g., Excel, GIS) to organise and visualise data is encouraged.
Data Presentation Techniques
Effective presentation of field data supports clearer understanding and geographical argumentation.
Common methods include:
Graphs: bar charts, line graphs, scatter graphs for temporal data
Maps: GIS-based thematic maps showing rainfall or carbon emissions
Diagrams: annotated sketches of field sites or flow paths
Tables: to clearly display numerical results
Each presentation method should suit the type of data being shown and must include clear titles, units, and keys.
Qualitative Skills
Qualitative skills are equally essential, especially when dealing with complex environmental interactions.
Descriptive Observations
Students should record visual, sensory, and contextual observations in the field:
Noting vegetation types and density
Assessing land use and surface characteristics
Describing weather conditions and surface water features
These observations add context to quantitative data, such as why infiltration may be low in urbanised areas.
Interpretation of Secondary Sources
Geographers often use secondary qualitative data to inform analysis. Sources might include:
Aerial photographs and satellite images
Government or NGO reports
Newspaper articles and environmental statements
Students must be able to evaluate source reliability and link qualitative insights to measured data.
Application to Water and Carbon Cycles
Understanding how to apply skills to specific topics is a key requirement of the AQA course.
For the water cycle, skills are used to:
Assess flood risk through hydrograph interpretation
Monitor seasonal changes in precipitation and runoff
Examine impacts of urban development on infiltration and evapotranspiration
For the carbon cycle, skills help:
Evaluate changes in vegetation carbon storage over time
Investigate effects of land use change on carbon emissions
Analyse data on carbon sequestration in different ecosystems
These applications show how data skills deepen understanding of system dynamics and feedbacks.
Importance of Accuracy and Evaluation
A key part of fieldwork and data handling is the evaluation of methods and results.
Students must be able to:
Identify limitations in data collection techniques (e.g., human error, equipment sensitivity)
Discuss the representativeness of data samples
Propose improvements to methods and alternative approaches
A critical approach enhances the reliability of conclusions drawn about the hydrological and carbon processes under investigation.
Practice Questions
Define the term mass balance and explain how it applies to the water cycle. (2 marks)
1 mark for an accurate definition:
Mass balance is the comparison of inputs and outputs in a natural system to determine whether they are in equilibrium.1 mark for applying the term to the water cycle:
It can be used to assess whether a drainage basin is gaining or losing water based on precipitation, evapotranspiration, and runoff.
Explain how field data collection and analysis can be used to investigate changes in the water cycle within a river catchment. (6 marks)
Award up to 6 marks for the following points, with credit given for depth, accuracy, and relevance.
1 mark: Identifying a relevant field method (e.g. rain gauge, flow metre).
1 mark: Describing the type of data collected (e.g. rainfall amount, discharge levels).
1–2 marks: Explaining how the data shows change over time or space.
1–2 marks: Linking analysis (e.g. graphing, statistical calculation) to interpreting processes such as runoff or infiltration.
1 mark: Acknowledging limitations or suggesting how reliability might be improved.
Answers should show understanding of both data collection and analysis within the context of hydrological change.
FAQ
Absolute data refers to raw, measured values such as 45mm of rainfall or 0.2m³/s stream discharge. These are fixed values with specific units.
Relative data is comparative, showing how a value changes in relation to something else—such as percentage change, rank, or index values. It’s useful for identifying patterns over time or between sites without relying solely on raw numbers.
Both are important: absolute data provides accuracy, while relative data supports interpretation.
Calibration ensures that instruments used to measure rainfall, river flow, or soil moisture provide accurate and consistent readings.
Uncalibrated equipment can lead to:
Over- or underestimation of values
Inconsistent comparisons between sites or time periods
Flawed mass balance or trend analysis
Field tools like rain gauges or flow metres should be tested against standard measures before and after fieldwork to maintain data integrity.
Several statistical methods help identify trends and patterns in hydrological data:
Mean, median, mode – summarise central tendency
Range and standard deviation – show data spread
Spearman’s rank correlation – tests relationship between two variables (e.g. rainfall and runoff)
Anomalies and percentage change – highlight deviations from norm
These techniques allow students to move beyond description to meaningful data interpretation.
Geographic Information Systems (GIS) help visualise spatial patterns in hydrological data.
They allow students to:
Overlay rainfall, land use, and slope data
Map catchment areas and infiltration zones
Analyse spatial correlation between human activity and runoff
GIS is especially useful for presenting multi-layered data in catchment studies or water balance investigations.
Secondary data can be valuable for context or long-term comparisons, but it has drawbacks:
May be outdated or use inconsistent measurement methods
Often lacks local-scale accuracy for specific catchments
May not align with the time or scale of student fieldwork
Always cross-reference with primary data and evaluate the source's reliability before drawing conclusions.
