
AQA Specification focus:
‘Case study of a river catchment to illustrate water cycle themes, field data analysis, precipitation impacts, and sustainable water supply/flooding.’
A river catchment case study helps illustrate how precipitation, land use and human activity influence water cycle processes, hydrological responses, and sustainable water management.
River Catchment Overview
A river catchment (or drainage basin) is the area of land drained by a river and its tributaries. It acts as an open system, where water enters (inputs), is stored and transferred (stores and flows), and exits (outputs).
For AQA A-Level Geography, students must understand how a specific catchment—such as the River Eden in Cumbria—illustrates key water cycle dynamics, the impact of rainfall events, how data can be analysed, and management strategies for sustainability.
The River Eden catchment in Cumbria, England, spans approximately 2,500 km², rising in the Pennines and flowing northward to the Solway Firth, making it an ideal subject for examining fluvial processes and flood risk.
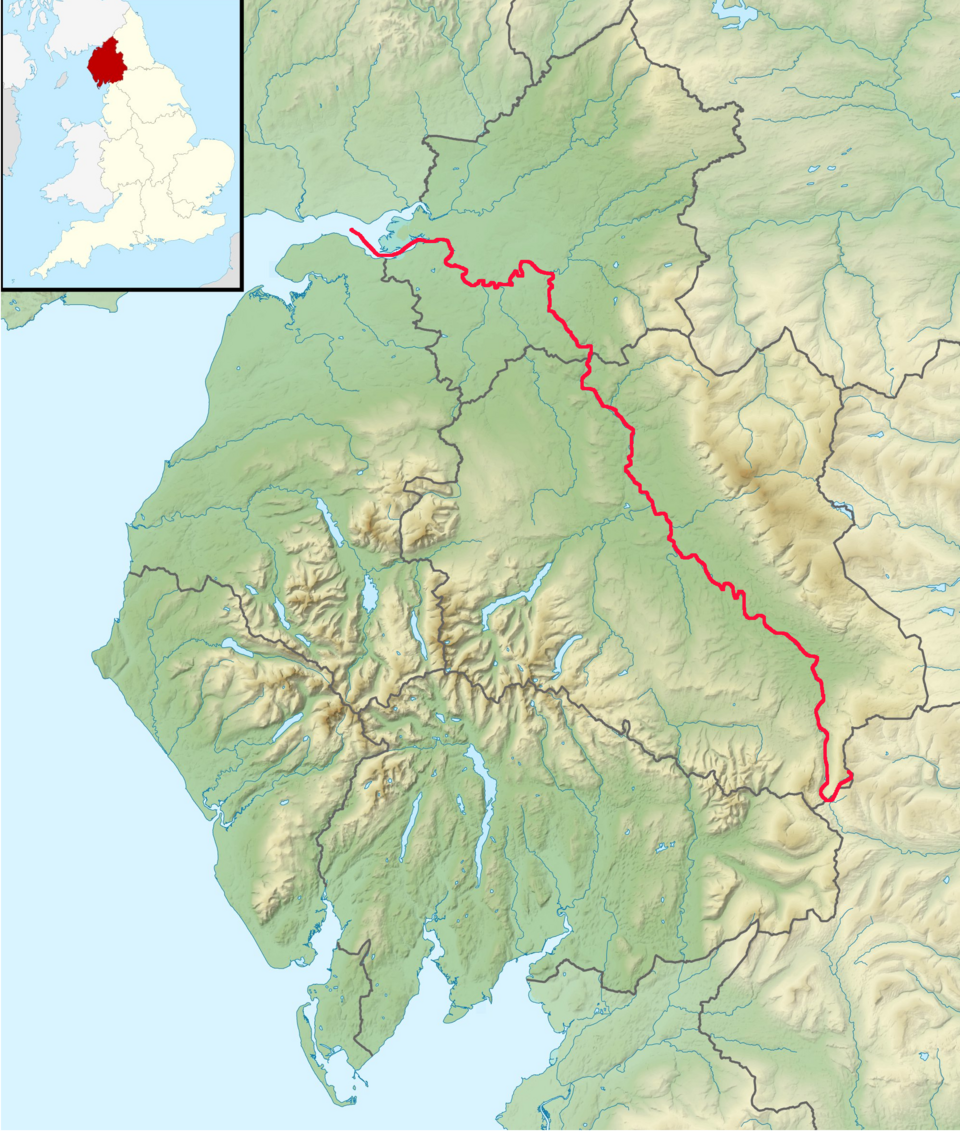
A detailed topographic map of the River Eden catchment, with the main channel and tributaries highlighted in red. Note that land-use patterns and elevation contours are included beyond the scope of the syllabus. Source
Water Cycle Themes in a River Catchment
The catchment demonstrates water cycle components, including:
Inputs: Primarily precipitation (rain, snow).
Stores: Interception by vegetation, surface storage (puddles, lakes), soil moisture, groundwater.
Flows: Infiltration, throughflow, percolation, groundwater flow, surface runoff.
Outputs: Evapotranspiration and river discharge into the sea or another basin.
In the River Eden catchment:
High precipitation due to relief rainfall and exposure to prevailing westerlies is a key input.
Thin soils and impermeable rocks reduce infiltration, increasing surface runoff.
Steep slopes promote rapid overland flow, affecting lag time and discharge rates.
Field Data Analysis in Catchments
Fieldwork in a river catchment enables students to collect and analyse quantitative and qualitative data to investigate water cycle processes.
Data collection might include:
Measuring discharge using velocity meters and cross-sectional area calculations.
Rainfall data from rain gauges.
Land use surveys (to assess impervious surfaces).
Soil infiltration tests.
Discharge: The volume of water flowing in a river at a given point, typically measured in cubic metres per second (cumecs).
Analysis involves comparing variables such as precipitation levels, lag time, peak discharge, and land cover to understand hydrological behaviour during different events.
GIS and data presentation tools can be used to analyse spatial and temporal variation across the catchment. For example:
Bar graphs for monthly rainfall.
Line graphs for hydrographs.
Annotated maps to show land use types and runoff potential.
Precipitation Impacts on the Catchment
Storm events and prolonged rainfall greatly influence the water cycle:
Short lag time due to impermeable geology and steep slopes causes flash floods.
Urbanisation increases impermeable surfaces, further shortening lag time and raising peak discharge.
Deforestation reduces interception and evapotranspiration, increasing soil saturation and surface runoff.
In December 2015, Storm Desmond led to severe flooding in the River Eden catchment:
Over 260 mm of rainfall in 48 hours.
River Eden reached a record peak discharge.
Carlisle experienced flooding due to overwhelmed storm drains and riverbanks.
A flood hydrograph for the Eden at Sheepmount demonstrates a short lag time of 12 hours and a steep rising limb, highlighting the catchment’s rapid response to intense rainfall.
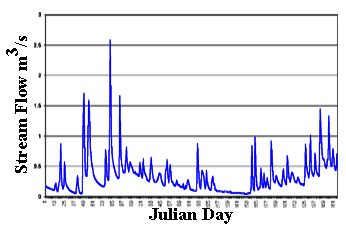
A standard stream hydrograph plotting discharge (m³/s) against time, with labelled rising and falling limbs and peak discharge. The green shading indicates baseflow, which goes beyond the specific case study data. Source
Flood hydrograph: A graph showing river discharge over time in response to a rainfall event, highlighting peak discharge, lag time, rising and falling limbs.
These precipitation impacts demonstrate the catchment's vulnerability to hydrological extremes, especially under changing climatic and land use conditions.
Sustainable Water Supply and Flooding
To ensure water security and reduce flood risk, the catchment employs sustainable management strategies:
1. Soft Engineering Strategies
Afforestation: Trees planted in upland areas increase interception and infiltration, reducing runoff.
River restoration: Reconnecting rivers to floodplains allows flood storage and natural water filtering.
Sustainable Urban Drainage Systems (SuDS): Green roofs, permeable pavements, and swales in Carlisle manage urban runoff.
2. Hard Engineering Strategies
Flood walls and embankments in Carlisle to protect from river overtopping.
Stormwater storage tanks and channel dredging to increase river capacity.
Sustainable water management: Managing water resources in a way that meets current needs without compromising the ability of future generations to meet theirs.
These approaches aim to mitigate future flooding while maintaining ecological balance in the catchment.
3. Monitoring and Modelling
The Environment Agency monitors river levels and rainfall in real-time using telemetry systems.
Hydrological models predict flood events and inform emergency planning.
Community engagement and education on water conservation also play a key role.
Summary of Key Concepts Demonstrated by the River Eden Catchment
Inputs, outputs, stores and flows illustrate the functioning of a drainage basin.
Field data supports geographical enquiry into water cycle processes.
Precipitation events, such as Storm Desmond, show the catchment's flood response.
Sustainable water management combines engineering, environmental restoration, and public policy to reduce future risk.
This case study aligns with the AQA requirement to explore how a real-world catchment exemplifies hydrological concepts, precipitation impacts, and sustainable solutions to flood risk.
Practice Questions
Define what is meant by a ‘river catchment’. (2 marks)
1 mark – A river catchment is the area of land drained by a river and its tributaries.
1 mark – It acts as an open system with inputs (e.g. precipitation) and outputs (e.g. discharge).
Explain how human activity can influence the water cycle within a river catchment. (6 marks)
Level 1 (1–2 marks):
Basic, generalised statements with limited explanation. May mention human activity or water cycle components but lacks specific detail.
Example: “People build on land which causes flooding.”
Level 2 (3–4 marks):
Some understanding shown. At least one human activity is explained with reference to its impact on water cycle processes. Some use of appropriate terminology.
Example: “Urbanisation leads to more impermeable surfaces, reducing infiltration and increasing surface runoff.”
Level 3 (5–6 marks):
Clear and developed explanation of two or more human activities with explicit links to water cycle components such as stores and flows. Uses appropriate geographical terminology throughout.
Example: “Deforestation reduces interception and evapotranspiration, increasing the volume of water reaching the ground and contributing to higher runoff. Water abstraction for agriculture can lower the water table, reducing groundwater flow and store levels.”
FAQ
The River Eden catchment has steep topography, particularly in the Pennines, which accelerates surface runoff. The area also features impermeable bedrock (e.g. Carboniferous limestone and Millstone Grit), limiting infiltration and promoting overland flow.
In addition, thin soils and limited vegetation cover in upland zones reduce interception and water storage capacity. These physical characteristics contribute to short lag times and a flashy hydrograph during storm events.
Agricultural practices such as grazing and field drainage reduce vegetation cover and soil infiltration, leading to greater surface runoff.
Urban areas like Carlisle introduce:
Impermeable surfaces (roads, roofs)
Channelisation of rivers
Reduced floodplain storage
These factors increase flood risk by elevating discharge levels and decreasing lag time during heavy rainfall.
Fieldwork activities in river catchments can include:
Measuring river discharge at multiple sites using velocity flow meters and cross-sectional surveys
Infiltration testing across different land uses (e.g. pasture, woodland, urban)
Mapping and recording slope angles and soil types
Using GPS and GIS tools to plot spatial data across the catchment
These techniques help assess how hydrological processes vary spatially and temporally.
Vegetation intercepts rainfall, increases evapotranspiration, and promotes infiltration through root systems. In wooded areas, water is stored in leaf litter and soil, slowing down runoff.
The presence of vegetation can:
Reduce peak discharge and delay hydrograph response
Stabilise soil and reduce erosion
Improve groundwater recharge
Loss of vegetation, through deforestation or overgrazing, disrupts these regulating functions.
Hydrological models use input data such as rainfall totals, land cover, soil type, and river channel capacity to simulate future scenarios.
Modelling can help:
Predict how different rainfall events will affect discharge
Assess the effectiveness of proposed flood defences
Plan urban development while managing flood risk
Real-time telemetry and historical flood data improve model accuracy and reliability.
