
Revenue analysis is a fundamental aspect of microeconomics, focusing on how firms generate income through sales. This section examines the concepts of total, average, and marginal revenue, each playing a pivotal role in business strategies and economic theory.
Introduction to Revenue
Revenue is the income generated from normal business operations, primarily through the sale of goods and services. Understanding different revenue types helps businesses in pricing, output decisions, and overall financial planning.
Total Revenue (TR)
Total Revenue represents the entire income a firm earns from selling its products or services.
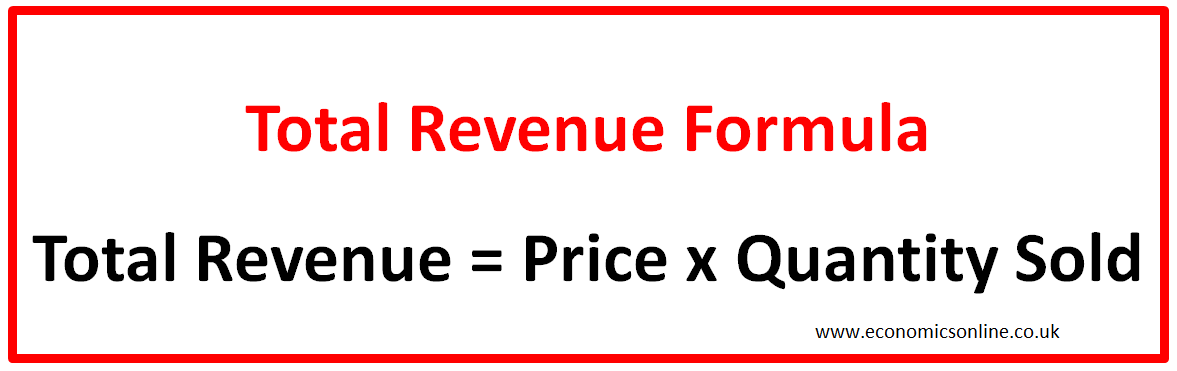
Image courtesy of economicsonline
- Formula: Total Revenue = Price per Unit × Quantity Sold
- Example: If a company sells 100 units of a product at £10 each, the TR is £1,000.
- Significance: TR is a primary indicator of a company's financial performance and is crucial for assessing the viability of its business model.
Average Revenue (AR)
Average Revenue is the revenue a firm earns per unit of output sold.
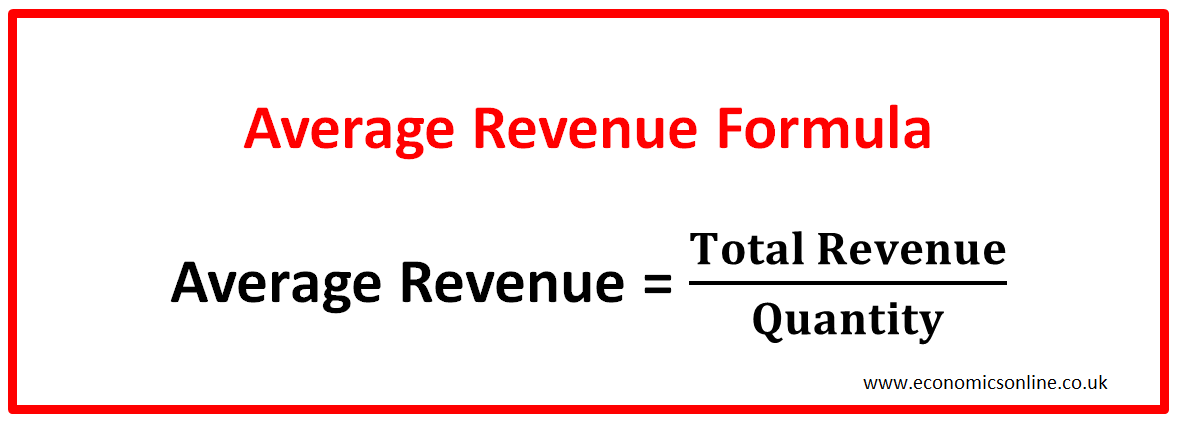
Image courtesy of economicsonline
- Formula: Average Revenue = Total Revenue / Quantity Sold
- Example: Using the TR example, if 100 units are sold, the AR is £10 (£1,000 / 100 units).
- Relevance: AR is important for understanding the per-unit profitability and is particularly useful in price-setting and assessing market demand.
Marginal Revenue (MR)
Marginal Revenue refers to the additional revenue generated from selling one additional unit.
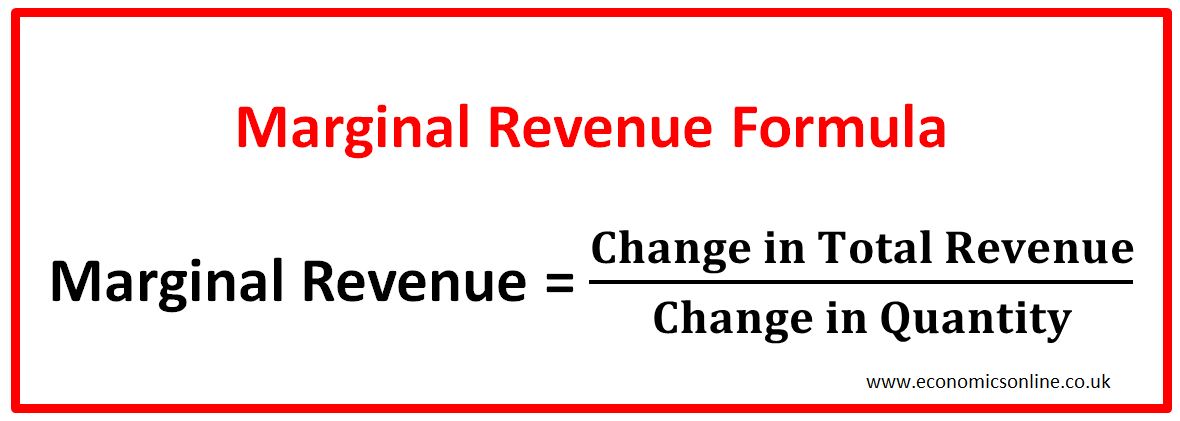
Image courtesy of economicsonline
- Formula: Marginal Revenue = Change in Total Revenue / Change in Quantity Sold
- Example: If selling an additional unit increases TR from £1,000 to £1,010, the MR is £10.
- Key Points:
- Under perfect competition, MR equals the price.
- In monopolies or oligopolies, MR decreases with additional units sold.
- Strategic Importance: MR is vital for determining optimal production levels. If MR is higher than marginal cost, producing more can increase profits.
Relationship Between AR and MR
The relationship between Average and Marginal Revenue is crucial in market analysis.
- In Perfect Competition:
- AR and MR are equal and constant, reflecting the market price.
- In Imperfect Markets:
- MR decreases faster than AR due to price reductions needed to sell additional units.
Graphical Analysis
Visual representations of revenue concepts provide clear insights into their behavior under different market conditions.
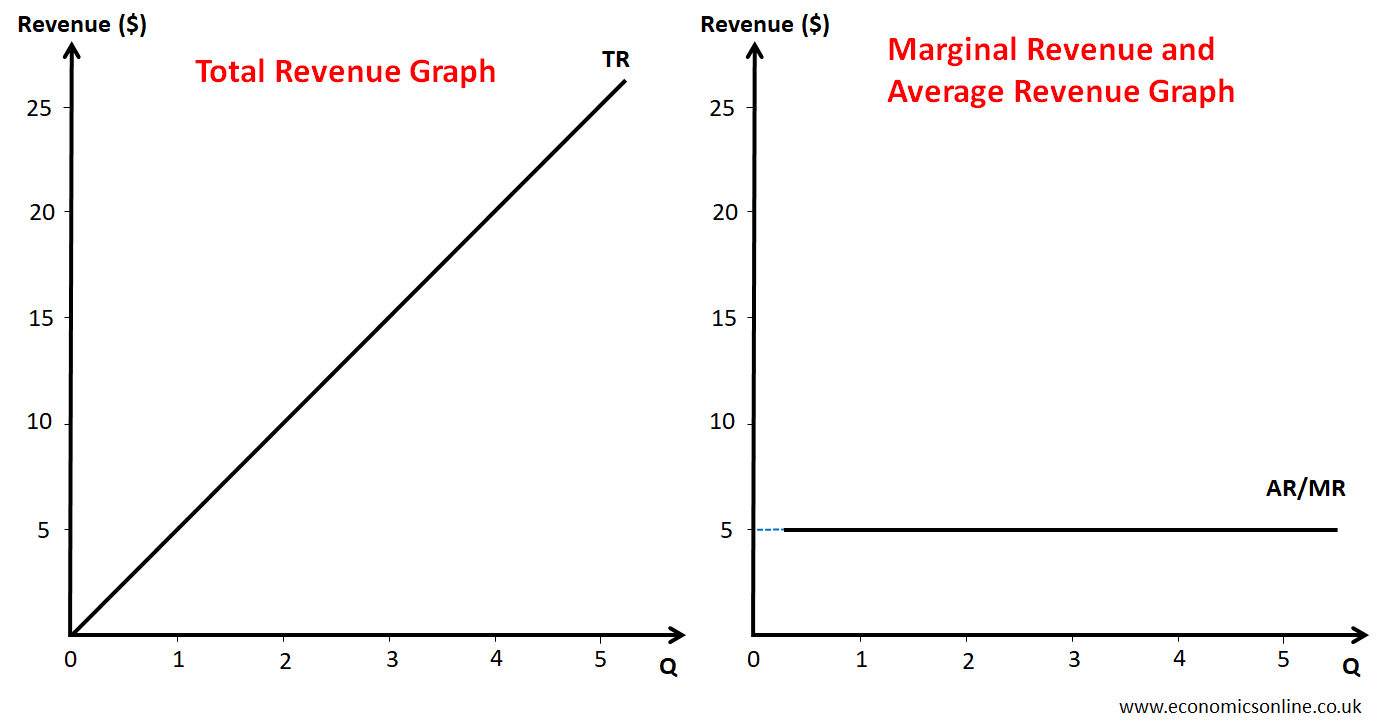
Image courtesy of economicsonline
Total Revenue Curve
- Characteristics: In perfect competition, the TR curve is linear and upward sloping, reflecting a constant price.
- Interpretation: The slope indicates the rate at which revenue increases with each unit sold.
Average Revenue Curve
- Shape: Generally horizontal in perfect competition, indicating a constant price.
- Analysis: In monopolistic markets, the AR curve slopes downward, reflecting decreasing prices with increased output.
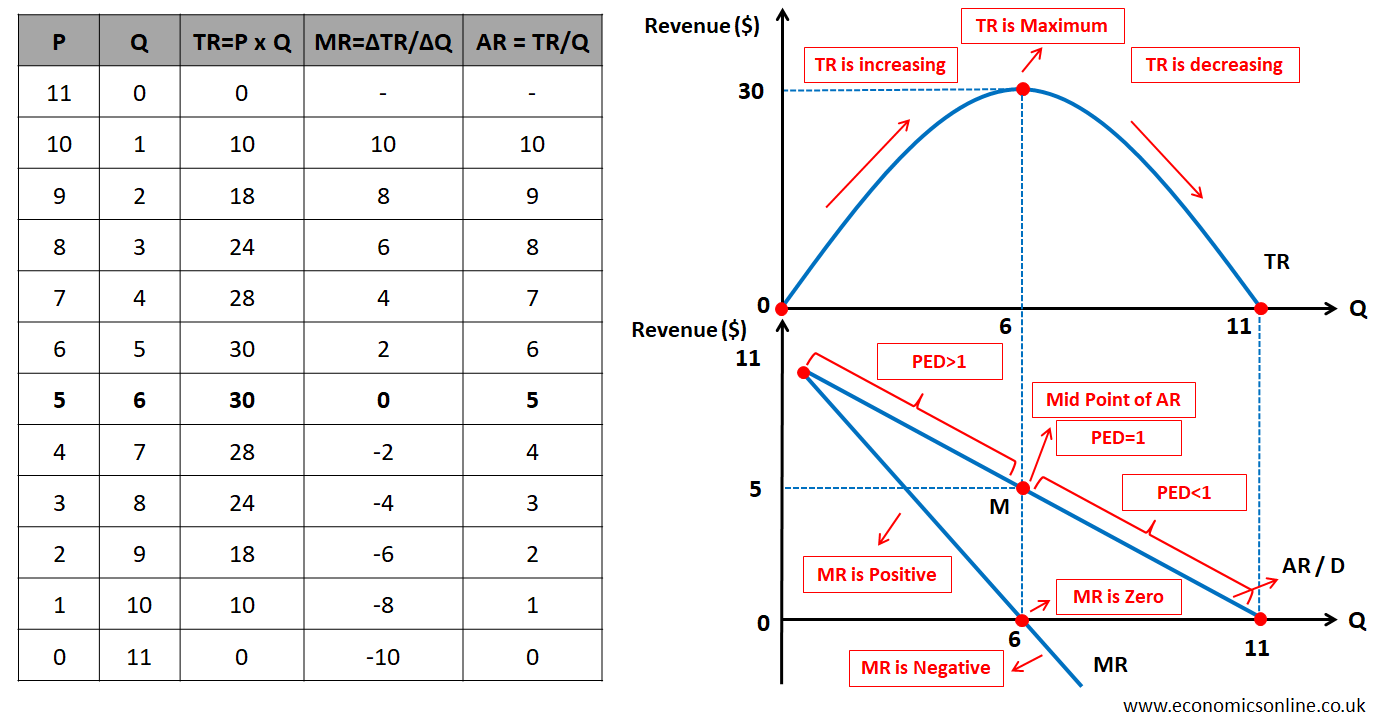
Image courtesy of economicsonline
Marginal Revenue Curve
- In Perfect Competition: MR curve coincides with the AR curve and price line.
- In Monopolistic Competition: MR curve falls below the AR curve, showing diminishing marginal revenue with increased output.
Application in Market Structures
The behavior of AR and MR is indicative of the market structure a firm operates in.
- Perfect Competition: Characterised by many sellers, free entry and exit, and a homogeneous product, leading to equal AR and MR.
- Monopoly: A single seller with significant control over prices, resulting in a decreasing MR curve.
- Oligopoly: Few dominant firms, often leading to complex interdependencies in AR and MR dynamics.
Revenue and Decision-Making
Revenue metrics are integral to strategic business decisions.
- 1. Pricing Strategy: Understanding AR helps in setting prices that maximise per-unit revenue.
- 2. Output Decisions: MR analysis assists in determining the most profitable level of production.
- 3. Market Strategy: Revenue trends can indicate when to enter or exit a market or when to diversify product offerings.
Real-World Examples
- Retail Industry: Supermarkets often use AR and MR to price goods, balancing between volume sales and per-unit profitability.
- Technology Sector: Companies like smartphone manufacturers analyse MR to decide on production scales and pricing tiers.
Challenges in Revenue Analysis
- Data Accuracy: Reliable data is essential for calculating TR, AR, and MR.
- Market Variability: Changes in market conditions can rapidly alter revenue dynamics.
- Cost Considerations: Revenue analysis must be coupled with cost analysis for a complete picture of profitability.
Conclusion
Revenue analysis, encompassing total, average, and marginal revenue, offers invaluable insights into a firm's operational efficiency and market position. These concepts not only guide business strategies but also enrich the understanding of various market structures and economic theories. For students of economics, mastering these concepts is crucial for analysing and predicting business and market behaviour.
Practice Questions
Marginal Revenue (MR) is calculated as the change in Total Revenue (TR) divided by the change in quantity sold. In this case, the change in TR is £2,250 - (£15 × 100) = £750, and the change in quantity is 150 - 100 = 50 units. Thus, MR = £750 / 50 = £15. In a perfectly competitive market, the MR equals the price per unit, as seen here. This is significant because it indicates that the firm is a price taker with no control over the market price. The MR remaining constant at the market price illustrates the characteristic feature of perfect competition, where firms can sell as many units as they like at the market price.
In a perfectly competitive market, the Marginal Revenue (MR) curve is horizontal, indicating that MR is constant and equal to the market price. This occurs because firms are price takers and can sell any amount of output at the market price. Conversely, in a monopolistic market, the MR curve slopes downwards. This is because a monopolist faces a downward-sloping demand curve and must lower the price to sell additional units, leading to a decrease in MR with each additional unit sold. The diminishing MR in a monopoly reflects the monopolist's market power and the impact of its pricing decisions on its revenue.
FAQ
Marginal Revenue (MR) is a critical factor in a firm's decision-making process as it represents the additional income generated from selling one more unit of a product. This information is vital for determining the optimal level of production. A key principle in economics is that a firm should continue producing as long as MR is greater than the marginal cost (MC) of producing another unit. When MR equals MC, the firm maximises its profit. If MR is below MC, producing additional units would lead to a loss on each extra unit produced. Therefore, MR is essential for profit maximisation strategies. Additionally, in varying market structures like monopolies or oligopolies, understanding MR helps in strategising pricing policies to maximise revenue, as these firms have more control over their product prices.
The concept of diminishing marginal revenue is closely related to the law of diminishing returns in production. The law of diminishing returns states that adding an additional factor of production results in smaller increases in output after a certain point. Similarly, diminishing marginal revenue is the phenomenon where the additional revenue gained from selling one more unit decreases with each additional unit sold. This typically occurs in imperfect competition settings, such as monopolies or oligopolies, where the firm must lower the price to sell more units, leading to a decrease in revenue per unit. Both concepts reflect a common economic principle: the decrease in the additional output or revenue gained from increasing the input or production level.
In a monopoly, the revenue curves exhibit distinct characteristics compared to those of a perfectly competitive firm. A monopolist's Average Revenue (AR) curve is downward sloping, reflecting the market demand curve. As a monopolist reduces the price to increase sales, the average revenue per unit decreases. Consequently, the Marginal Revenue (MR) curve in a monopoly lies below the AR curve, as each additional unit sold generates less revenue than the previous unit. This contrasts with a perfectly competitive firm, where the AR and MR curves are horizontal and coincide with each other, representing the constant market price. These differences arise because a monopolist has market power to set prices, whereas a firm in perfect competition is a price taker.
Marginal Revenue (MR) plays a pivotal role in a firm's pricing strategy, especially in markets with imperfect competition, such as monopolistic competition or oligopoly. Firms in these markets have some degree of control over the price of their products. The MR helps in determining the price that maximises profits. If MR is greater than the marginal cost (MC), the firm can increase its profits by lowering the price to sell more units. However, if MR is less than MC, the firm could increase its profits by raising the price and selling fewer units. This balancing act between the price, MR, and MC is crucial for setting the optimal price that maximises the firm’s profits. For monopolies, this analysis is critical as the price elasticity of demand and the slope of the demand curve directly influence MR and, consequently, the pricing decisions.
Price elasticity of demand significantly impacts Marginal Revenue (MR). If demand is elastic (elasticity greater than 1), lowering the price increases the total revenue, as the percentage increase in quantity demanded is greater than the percentage decrease in price. Here, MR remains positive, as each additional unit sold adds more to the revenue than it subtracts by the lower price. Conversely, if demand is inelastic (elasticity less than 1), lowering the price reduces total revenue, since the percentage increase in quantity demanded is less than the percentage decrease in price. In this scenario, MR can become negative, meaning that selling an extra unit reduces total revenue. This relationship is crucial for firms, particularly monopolies, in making decisions about pricing and output levels. Understanding the elasticity of their product's demand helps them determine the most profitable price and quantity combination.
