
IB Syllabus focus:
‘Zonation is community change along gradients (elevation, tidal level, distance to water). Use transects, abiotic measurements, and kite diagrams to analyze distributions.’
Zonation refers to how species and communities change gradually along measurable gradients in their environment, revealing essential ecological patterns and species–environment relationships.
Understanding Zonation
Zonation describes the spatial change in ecological communities along an environmental gradient such as elevation, tidal level, or distance to water. It differs from succession, which focuses on temporal changes.
Zonation: The spatial distribution of species or communities in response to environmental gradients.
These gradients affect abiotic factors such as moisture, light availability, temperature, or salinity, which in turn determine which organisms can survive and compete in different zones.
Types of Gradients
Elevational Gradients
Increasing altitude results in decreasing temperature and oxygen levels.
Vegetation changes progressively, for example, from lowland forests to alpine meadows.
Tidal Gradients
In coastal ecosystems, organisms are distributed across zones shaped by tidal submersion and exposure.
Upper intertidal zones host desiccation-tolerant species, while lower zones support organisms adapted to continuous submersion.
Distance-to-Water Gradients
Along lakes or rivers, soil moisture decreases with distance from water.
Plants closer to water are often hydrophytes, while xerophytes dominate drier soils further away.
Measuring Zonation
Field ecologists use structured approaches to study zonation effectively. The most common techniques include:
Transect Sampling
A transect is a straight line placed across an environmental gradient. Along this line, species presence, abundance, and abiotic factors are recorded.
Line transects: note species touching the line at regular points.
Belt transects: survey a strip of habitat along the gradient.
Transect: A straight line or defined strip used for systematically sampling organisms and environmental conditions across a gradient.
Quadrats Along Transects
Quadrats (usually square frames) are placed systematically or at intervals along a transect. They provide quantitative data on:
Density (number of individuals per unit area).
Percentage cover (how much ground is covered by species).
Frequency (proportion of quadrats in which a species appears).
Abiotic Measurements
Abiotic variables influence zonation strongly and must be measured alongside biological data:
Temperature (°C).
Soil pH (using probes or indicator kits).
Moisture levels (soil water content meters).
Light intensity (lux meters).
Salinity (electrical conductivity meters).
Recording abiotic conditions clarifies the cause–effect relationships behind observed zonation patterns.
Analysing Zonation Patterns
Kite Diagrams
One of the clearest tools for displaying zonation is the kite diagram, a graphical representation showing species abundance along a transect.
Abundance values are plotted symmetrically on either side of the central axis.
Each species creates a distinctive “kite-shaped” curve across the gradient.
The diagram highlights species overlap, dominance, and turnover between zones.
Kite diagrams summarise species abundance across a transect, making zonation patterns easy to see.
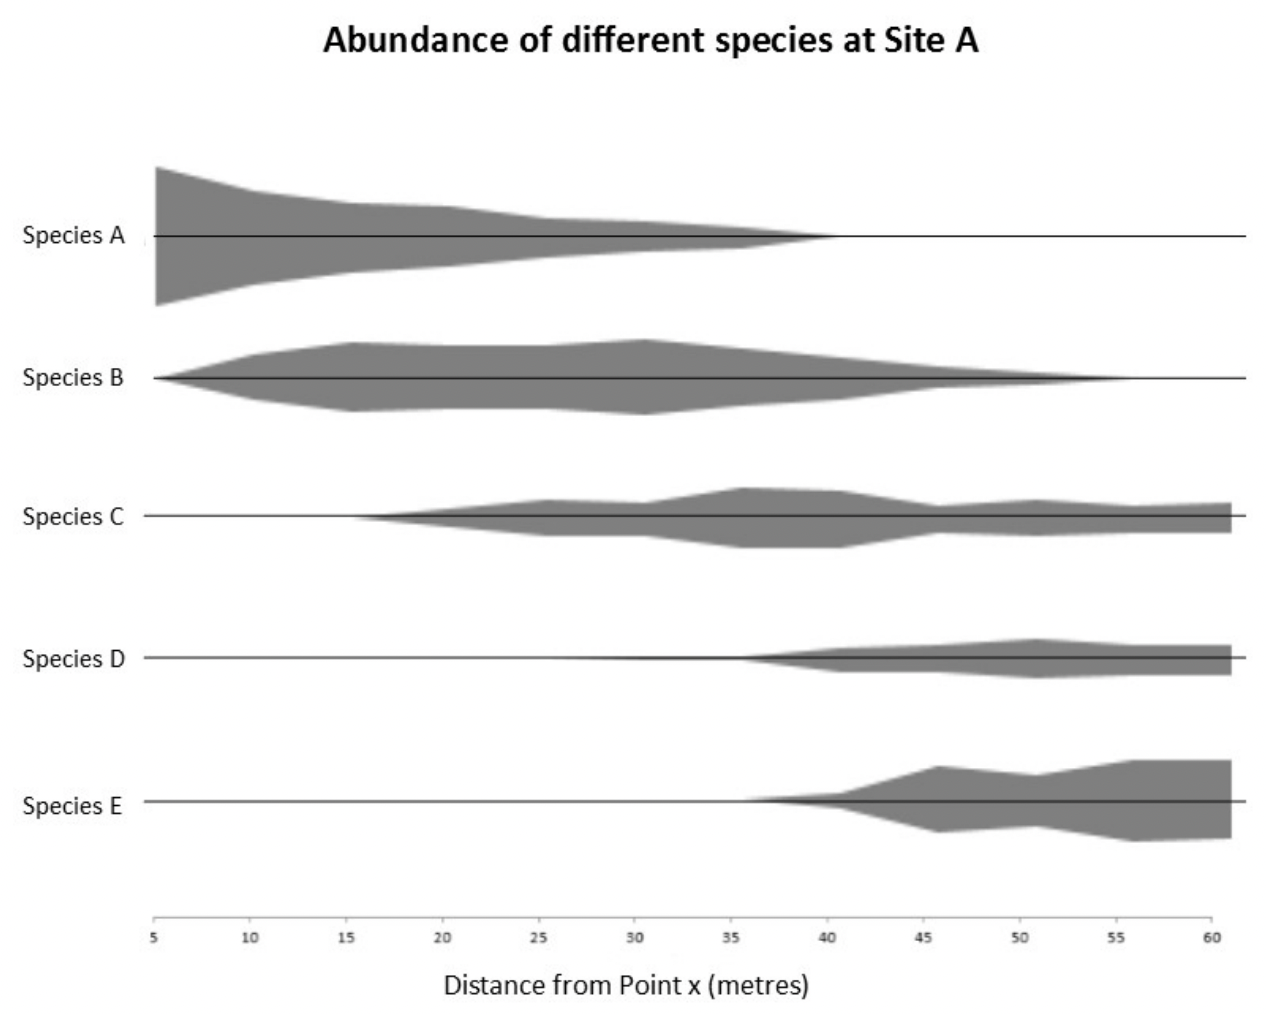
Example kite diagram showing relative abundance of five species along a distance-marked transect. The central axis is distance, and the “kite” width indicates abundance at each point. This visualisation supports interpreting zonation patterns from systematic belt or line transect data. Source.
Species Turnover and Boundaries
Species turnover occurs when one species declines while another increases along the gradient.
Zonation boundaries are rarely sharp; they usually show overlapping ranges.
Identifying Ecological Niches
Through zonation analysis, ecologists can infer a species’ ecological niche, which is its role and position in an ecosystem, including conditions needed for survival.
Importance of Studying Zonation
Studying zonation provides insights into:
How abiotic and biotic factors interact.
The resilience of ecosystems under environmental stress.
Predicting species’ responses to climate change and habitat modification.
For example, tidal zonation studies predict how rising sea levels may compress intertidal habitats, affecting biodiversity.
Step-by-Step Field Approach
To study zonation effectively, students and ecologists typically:
Identify the gradient (e.g., tidal height, distance from water).
Lay out a transect line across the gradient.
Place quadrats at regular intervals along the transect.
Record species data (density, cover, frequency).
Measure abiotic variables at the same points.
Graph results using kite diagrams or other distribution plots.
Interpret ecological patterns in terms of environmental conditions.
Line or belt transects with quadrats placed at regular intervals allow systematic sampling across the gradient.
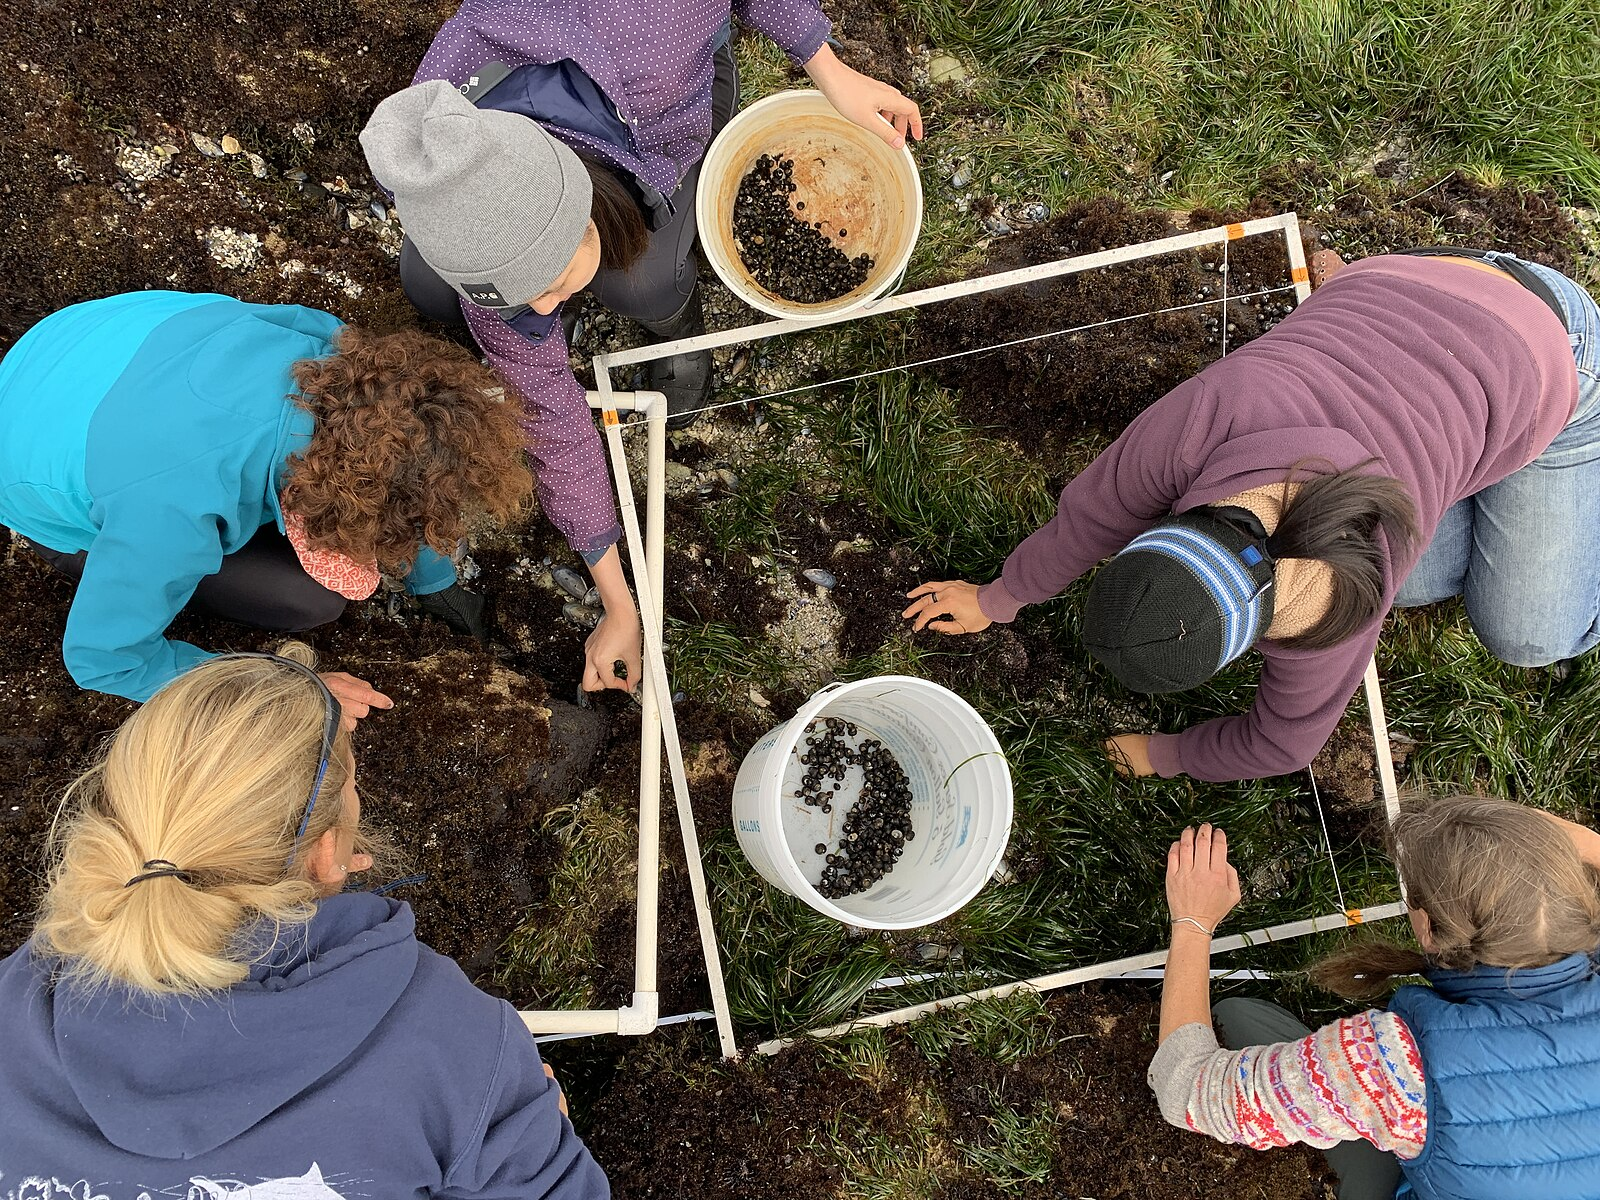
Researchers placing a quadrat beside a laid transect line across a rocky shore, sampling species along the tidal gradient. This illustrates systematic station spacing and consistent quadrat size for comparable data. Use with concurrent abiotic measurements (e.g., substrate, exposure) to interpret zonation. Source.
This structured methodology ensures data are both quantitative and comparable.
Human Influence on Zonation
Human activities can disrupt natural zonation patterns by altering gradients:
Urbanisation creates heat islands, shifting temperature gradients.
Agriculture modifies soil pH and moisture availability.
Coastal development interrupts natural tidal zonation.
Such changes can cause shifts in species distributions, reduce biodiversity, and alter ecosystem stability.
Practice Questions
Question 2 (5 marks):
Describe how ecologists use transects and abiotic measurements to study zonation patterns along a gradient.
Mark scheme:
Definition of zonation as the spatial distribution/change in communities along an environmental gradient (1 mark).
Correct example of an environmental gradient (e.g., elevation, tidal level, distance to water) (1 mark).
Question 2 (5 marks):
Describe how ecologists use transects and abiotic measurements to study zonation patterns along a gradient.
Mark scheme:
Mention of transects as a line/strip laid across a gradient to record species presence and abundance (1 mark).
Explanation of quadrats used systematically or at intervals along the transect (1 mark).
Identification of data collected on species (e.g., density, frequency, percentage cover) (1 mark).
Inclusion of abiotic factors measured (e.g., temperature, light intensity, pH, salinity, soil moisture) (1 mark).
Explanation of how combining biotic and abiotic data clarifies relationships and patterns of zonation (1 mark).
FAQ
Continuous distributions occur when species abundance changes gradually with no clear boundaries, such as trees thinning with altitude.
Zoned distributions show more distinct bands where certain species dominate under specific conditions, such as barnacles occupying different tidal zones.
Kite diagrams allow ecologists to:
Visualise species abundance across the same transect.
Compare overlaps, showing where species coexist.
Identify dominance patterns and turnover points along a gradient.
This makes them effective for interpreting community structure in complex environments.
Tidal zones are highly predictable, with clear changes in exposure, moisture, and salinity.
This predictability allows ecologists to study how different species adapt to harsh upper zones versus more stable lower zones, producing classic zonation patterns.
Accessibility issues in steep or hazardous gradients (e.g., cliffs, rocky shores).
Abiotic factors fluctuating daily or seasonally, complicating measurements.
Human disturbance altering natural distributions, making results less representative.
These challenges require careful sampling design and repeated observations.
Zonation patterns reveal the conditions under which species survive and reproduce.
By mapping distributions along gradients, ecologists can identify the limits of tolerance, competitive abilities, and resource use of each species, helping define their ecological niches.
