
IB Syllabus focus:
‘Diversity reflects species richness and evenness. Simpson’s reciprocal index quantifies diversity for comparisons and monitoring; higher values indicate more species and more even abundances.’
Biodiversity measurement is essential for conservation and ecological understanding. Species diversity combines both the number of species present and how evenly individuals are distributed among them, giving insight into ecosystem health.
Understanding Species Diversity
Species Richness
Species richness refers simply to the number of different species present in an ecosystem. It does not account for how many individuals of each species exist.
Species Richness: The total count of different species in a defined area, without considering the abundance of individuals in each species.
While a higher richness usually indicates a healthier system, richness alone may be misleading if one species dominates heavily.
Species Evenness
Species evenness describes how equal the populations of each species are in an ecosystem.
Species Evenness: A measure of how similar the abundances of different species are within a community.
High evenness means individuals are distributed fairly equally among species, while low evenness indicates dominance by one or a few species.
Combining Richness and Evenness
Why Both Are Important
An ecosystem with high richness but low evenness may still be vulnerable, since one species dominates the system.
An ecosystem with moderate richness but high evenness may demonstrate greater resilience because resources are used more broadly and species play complementary ecological roles.
Thus, effective biodiversity assessment requires consideration of both richness and evenness together.
Diversity reflects species richness and evenness.
Simpson’s Reciprocal Index of Diversity
Purpose of the Index
The Simpson’s Diversity Index provides a single value reflecting both richness and evenness. It allows comparisons across ecosystems and monitoring over time.
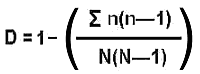
Simpson’s Diversity Index (D) = N(N − 1) / Σn(n − 1)
D = Diversity index value (dimensionless)
N = Total number of individuals of all species
n = Number of individuals of a particular species
Σ = Summed across all species present
The reciprocal form (1/D) is commonly used because higher values correspond to greater diversity.
Simpson’s reciprocal index quantifies diversity for comparisons and monitoring; higher values indicate more species and more even abundances.
The Simpson’s diversity index shows how dominance lowers diversity by weighting common species more heavily: D=∑ni(ni−1)/[N(N−1)]D=\sum n_i(n_i-1)/[N(N-1)]D=∑ni(ni−1)/[N(N−1)] or D=∑pi2D=\sum p_i^2D=∑pi2. IB ESS commonly reports the reciprocal (1/D)(1/D)(1/D), which increases with both richness and evenness. Note: the hosting page also includes a worked example; that extra detail is not required for this subsubtopic. Source.
Applications in Monitoring Biodiversity
Conservation and Management
Simpson’s Index is used by conservationists, ecologists, and governments for:
Tracking biodiversity changes after disturbances such as deforestation, pollution, or climate change.
Comparing ecosystems (e.g., grassland vs. forest).
Assessing conservation success by monitoring diversity before and after restoration or protection efforts.
Long-Term Value
Allows early detection of biodiversity decline, signalling reduced ecosystem resilience.
Provides quantitative evidence supporting policy, conservation funding, and prioritisation of threatened areas.
Factors Affecting Diversity Measures
Sampling Techniques
Reliable biodiversity monitoring requires:
Adequate sample size to capture both common and rare species.
Standardised methods across different sites for comparison.
Limitations of the Index
Sensitive to sample size: small samples may underrepresent true diversity.
Does not indicate which species are present, only their distribution and abundance.
Best used in combination with qualitative observations and other indices.
Biodiversity and Ecosystem Resilience
Linking Diversity to Stability
High species richness and evenness spread ecological functions across multiple species, reducing the risk that one loss destabilises the system.
Monocultures or systems with low evenness are more vulnerable to pests, disease, and environmental change.
Ecosystem Services Connection
Diverse communities provide more ecosystem services such as nutrient cycling, pollination, and climate regulation.
Maintaining balanced richness and evenness ensures sustainability of these functions for human benefit.
Summary of Key Points
Species richness = number of species present.
Species evenness = balance in abundance across species.
Simpson’s reciprocal index integrates both factors, with higher values indicating greater diversity.
Essential for monitoring biodiversity, comparing ecosystems, and guiding conservation.
Ensures understanding of ecosystem resilience and ability to recover from disturbances.
Practice Questions
Question 1 (2 marks)
Define species richness and species evenness and explain how they differ.
Mark scheme:
1 mark: Correct definition of species richness (number of different species present in an ecosystem).
1 mark: Correct definition of species evenness (relative abundance of individuals across species) and explanation that richness counts species, while evenness measures balance.
Question 2 (5 marks)
Explain how the Simpson’s reciprocal index of diversity (1/D) incorporates both species richness and species evenness. Discuss why this makes it a more reliable measure of biodiversity than richness alone.
Mark scheme:
1 mark: States that Simpson’s reciprocal index includes both the number of species (richness) and their relative abundances (evenness).
1 mark: Recognises that higher values indicate greater diversity, reflecting more species and more even distribution.
1 mark: Explains that low values indicate dominance by one or few species despite possible high richness.
1 mark: Explains that richness alone may misrepresent diversity if one species dominates.
1 mark: Overall explanation of why Simpson’s index is more reliable for comparing ecosystems or monitoring changes over time.
FAQ
Species evenness is often calculated by dividing the observed diversity (for example, using Simpson’s Index) by the maximum possible diversity if all species were equally abundant.
This gives a value between 0 and 1, where 1 indicates perfect evenness. Field ecologists use this to compare balance across communities without being misled by richness alone.
The original Simpson’s Index (D) decreases as diversity increases, which can be unintuitive.
The reciprocal form (1/D) corrects this by making higher values correspond directly to higher diversity. This makes interpretation and comparison across ecosystems more straightforward.
Very small sample sizes can exaggerate dominance or mask rare species.
Communities with many rare species may appear less diverse if one species is locally abundant.
Seasonal changes can alter abundances temporarily, affecting the calculation.
Researchers therefore often repeat sampling at different times and scales for accuracy.
Ecosystems with high diversity spread ecological roles across many species. This reduces the chance that an invasive species can dominate.
By contrast, ecosystems with low evenness or few species are more vulnerable, since invaders can exploit unoccupied or weakly defended niches.
Provides a consistent, quantitative value that allows comparisons across years.
Detects gradual declines in evenness or richness before they become obvious.
Can be applied to different ecosystems with standardised methods, making regional or global comparisons possible.
This helps governments and NGOs set priorities and evaluate the success of conservation strategies.
